The Google Analytics 4 (GA4) connector tools in Mark (Optimizely Agent Platform) let you query and visualize the web traffic data tracked in GA4 directly from Mark. Use them to monitor live visitors, compare conversion funnels, or break down traffic sources without leaving Mark. To enable the tools, an administrator configures the Google Analytics 4 connector on the Connectors page. After the connector is installed, you click Connect on the tile to authenticate individually so the GA4 connector tools return only the data your Google account is permitted to view.
Important
If you previously used a service account or Application Default Credentials (ADC), your existing installation continues to work. To migrate, uninstall the Google Analytics 4 Mark app in the OCP App Directory and complete the steps in this article. The new flow uses Google OAuth and supports multiple GA4 properties.
Configure the Google Analytics 4 connector
When you click Configure, Mark opens the Configure Google Analytics 4 dialog. If the connector is not installed yet, an Install modal displays first. The dialog then has two steps: Settings, where you enter the details the connector needs to authenticate, and Tools, where you choose which tools to enable.
As a Mark administrator, complete the following steps:
Go to Connectors.
(Optional) Enter Google Analytics 4 in the Enter name field, or use the Provider, Active Status, and Provider Type filters to find the connector.
Click Configure on the Google Analytics 4 tile.
Note
The Install modal only displays if the connector is not installed yet. Installing adds the connector to your organization and makes its tools available. You install a connector once, for everyone.
On the Settings step, complete the following, and then click Next. The app stores these settings and applies them to everyone in your organization.
(Optional) Toggle Instance level Mark OAuth on to use a custom Google Analytics authentication provider connection, and then enter your Google Analytics Auth Provider ID. Most administrators can skip this setting.
Under GA4 Properties, enter the GA4 Property ID for each property you want Mark to access, and click Add Property after each one. You can also enter a Nickname to make a property easier to find later.
(Optional) Under Default Filter, enter a hostname in the Hostname Filter field to limit queries to a single domain. Enter only the hostname, without a protocol. For example, enter www.optimizely.com. Leave the field empty to query all tracked hostnames.
On the Tools step, select the tools that users can use by default, and then click Save. Each tool displays its type, such as Read, Create, Update, or Delete. Use the search field to find a tool, or click Deselect all to clear the selection. Tools that you do not select still display on the connector's Tools tab, but remain disabled until you select them.
After you configure the connector, the Google Analytics 4 tile displays Connect for you and for every Mark user in your organization. Click Connect to connect it.
Authenticate with Google
After an administrator configures the Google Analytics 4 connector, log in to Google from Mark to access your GA4 data. The connector tools authenticate each Mark user individually, so you only see GA4 data your Google account is already permitted to view.
If the tile displays Contact Admin instead of Connect, an administrator has not configured the connector yet. Click Contact Admin to send them a request, which displays in their Notifications.
To authenticate, complete the following steps in Mark:
Go to Connectors > Connectors.
Click Connect on the Google Analytics 4 tile.
Log in to Google.
After you authenticate, the GA4 connector tools become available in Mark chat, agents, and workflows.
GA4 connector tools
After an administrator configures the Google Analytics 4 connector and you authenticate with Google in Mark, you can call the following tools in Mark.
The GA4 connector tools are Mark-native tools that translate your prompts into GA4 Data API queries. Use them in chat, agents, and workflows to monitor live traffic, build funnel reports, look up dimensions and metrics, and generate historical reports without leaving Mark.
Click a tool's name to expand it and learn when to use it, its required and optional parameters, and example prompts for calling the tool. If you do not provide a required parameter, Mark prompts you for it.
When to use
See a comprehensive list of all custom dimensions and metrics available in GA4.
Understand what specific custom data points you can use for reporting and analysis.
Prepare to build custom reports or queries that involve your unique analytics data.
Parameters
None
Example prompts
What custom dimensions and metrics do I have in Google Analytics?
List all available custom dimensions and metrics.
Show me my custom analytics fields.
When to use
See a list of all standard dimensions available in Google Analytics.
Understand what attributes you can use to segment or filter your analytics data.
Prepare to build reports or queries that require standard dimensions.
Parameters
None
Example prompts
What are the available dimensions in Google Analytics?
List all standard dimensions I can use for reporting.
Show me the different ways I can break down my user data.
When to use
See a list of all standard metrics available in Google Analytics.
Understand what quantitative data points you can use for analysis and reporting.
Prepare to build reports or queries that require standard metrics.
Parameters
None
Example prompts
What metrics can I use in Google Analytics?
List all standard metrics for my reports.
Show me the quantitative data I can analyze.
When to use
Analyze how users move through a specific sequence of actions, such as a checkout or sign-up flow.
Identify drop-off points between steps in a user journey.
Compare funnel performance across devices, traffic sources, or other dimensions.
Measure conversion rates between key events, such as page views to purchases.
Understand what users do after completing or abandoning a funnel step.
Parameters
dateRanges – The time periods for the report. Accepts up to four date ranges. Supports relative values such as 30daysAgo or absolute dates such as 2025-01-01.
funnel – Defines the funnel steps. Each step requires a name and a filterExpression. Supports event filters (funnelEventFilter) and field filters (funnelFieldFilter), along with orGroup, andGroup, and notExpression combinations. Optional step properties include isDirectlyFollowedBy and withinDurationFromPriorStep.
(Optional) funnelBreakdown – Breaks down funnel results by a dimension, such as deviceCategory or country. Accepts an optional limit value (default is 5).
(Optional) funnelNextAction – Analyzes what users do after completing or abandoning a funnel step. Accepts a dimension such as eventName or pagePath, and an optional limit.
(Optional) segments – Defines user segments to compare funnel performance, such as mobile versus desktop users.
(Optional) dimensionFilter – Filters the entire funnel by a dimension value, such as country or device category.
(Optional) limit – Maximum number of rows to return. Accepts values between 1 and 100,000. Defaults to 10.
(Optional) returnPropertyQuota – Set to true to include Google Analytics property quota usage in the response.
Example prompts
Show me a funnel from page view to purchase over the last 30 days.
Analyze the checkout funnel (add to cart, begin checkout, and purchase) broken down by device type.
Where are users dropping off in the sign-up flow this month?
Compare the purchase funnel between mobile and desktop users.
Show me a funnel for organic visitors from first visit to session start to purchase.
What do users do after abandoning the checkout step?
When to use
See who is on your site right now, where they are coming from, and what they are doing.
Check if new events or tracking configurations are working correctly.
Query active users, events, traffic sources, device breakdowns, and conversions as they happen.
Parameters
dimensions – The attributes of user activity you want to see in your report (for example, country, deviceCategory, or eventName). You can find available standard dimensions using the get_dimensions tool.
metrics – The quantitative measurements you want to analyze (for example, activeUsers, eventCount, or sessions). You can find available standard metrics using the get_metrics tool.
(Optional) dimensionFilter – Filters the report by dimension values (for example, a specific country or device category).
(Optional) metricsFilter – Filters the report by metric value (for example, sessions greater than 100).
(Optional) limit – The maximum number of rows to return in your report. Defaults to 10,000 when not specified.
(Optional) offset – The starting row for your report. Use it with limit to paginate through large reports.
(Optional) currencyCode – The currency code to use for currency values in the report (for example, USD, EUR). When this field is empty, the report uses the property's default currency.
(Optional) returnPropertyQuota – Set to true to include Google Analytics property quota usage in the response.
(Optional) orderBys – A list of objects that sort the report by dimensions or metrics in ascending or descending order.
Example prompts
Show me the current active users on my site.
What countries are my active users coming from right now?
How many sessions are active in the last 30 minutes, broken down by device type?
Are there any conversions happening in real-time?
Show me active users and their device categories, but only for users from the United States.
When to use
Examine user demographics, where they come from, and how they interact with your content.
Monitor conversions, revenue, event counts, and other important metrics.
Break down your reports by various dimensions like country, device, or traffic source.
See how your metrics and dimensions change over time.
Parameters
dateRanges (list of objects) – The time periods for your report. Each range needs a startDate and endDate, plus an optional name. Dates can be absolute (for example, 2025-01-01) or relative (for example, yesterday, 30daysAgo, today).
Note
If you use multiple date ranges, do not include dateRange in your dimensions list because Google Analytics handles this automatically.
dimensions – List of attributes you want to include in your report to break down your data (for example, country, deviceCategory, or eventName). You can find available standard dimensions using the get_dimensions tool, and custom dimensions using get_custom_dimensions_and_metrics.
metrics – List of the quantitative measurements you want to analyze (for example, activeUsers, sessions, conversions, or totalRevenue). You can find available standard metrics using the get_metrics tool, and custom metrics using get_custom_dimensions_and_metrics.
(Optional) dimensionFilter – Filters the report by dimension value using a structured filter expression (for example, a specific country, device, or event).
(Optional) metricsFilter – Filters the report by metric value using a structured filter expression (for example, sessions greater than 100 or revenue in a range).
(Optional) limit – The maximum number of rows you want to see in your report. Use it to manage large datasets.
(Optional) offset – The starting row for your report. Use it with limit to paginate through large reports.
(Optional) currencyCode – The currency code (for example, USD or EUR) to use for any currency values in the report. If you leave this empty, the report uses your property's default currency.
(Optional) returnPropertyQuota – Set to true to include Google Analytics property quota usage in the response.
(Optional) orderBys – Sorts the report by dimensions or metrics in ascending or descending order (for example, sort by sessions descending).
Example prompts
Show me the active users and sessions for the last 30 days.
What were the top 5 countries for conversions last month?
How many purchases did we have in Q3 2024, broken down by device category?
Compare the bounce rate and average session duration between July and August 2025.
Give me a report on event counts foradd_to_cartandpurchaseevents, but only for users coming fromgoogle / cpc.
Configure instance-level Mark OAuth
Note
Configure this only if your organization manages its own OAuth provider. Most administrators can skip this section.
Configure this setting on the Settings step when you configure the Google Analytics 4 connector. Toggle Instance level Mark OAuth on, and then enter your Google Analytics Auth Provider ID, which is the ID of the Google Analytics Auth Provider configured in Mark.
Troubleshoot registration configuration issues
Already registered from another OCP accounterror in Mark when registering the GA4 connector tools.Mark returns this error when the GA4 tools are already registered from another OCP instance, or when the previous registration was not removed before the OCP app was uninstalled.
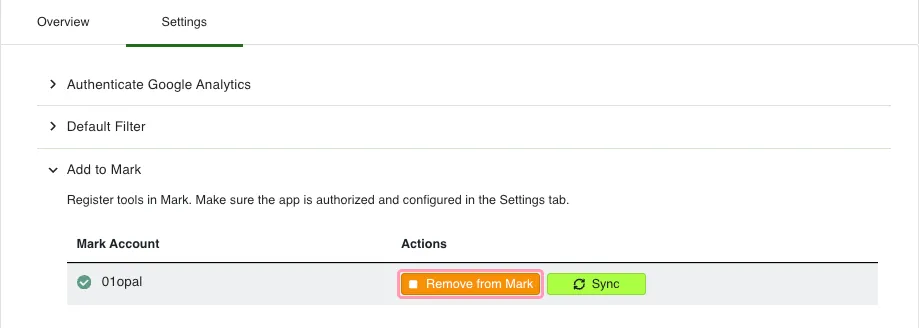
If the tools were registered from another OCP instance, an OCP administrator opens that OCP instance, goes to Google Analytics 4 Mark > Settings > Add to Mark, and clicks Remove from Mark.
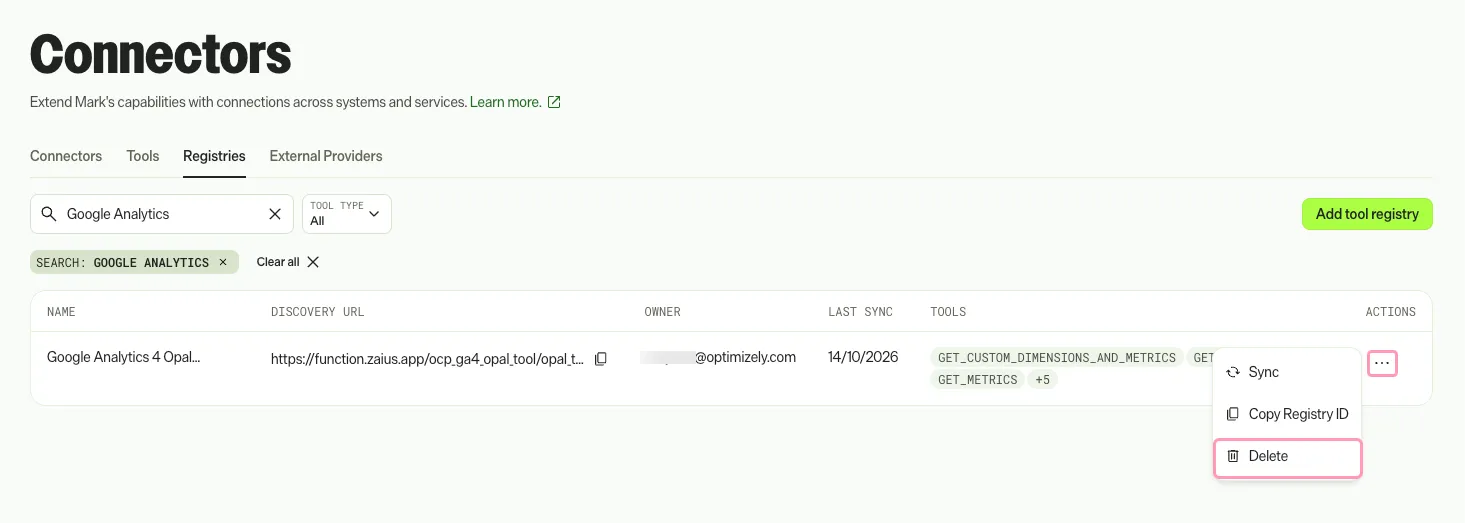
If the previous registration was not removed, a Mark administrator goes to Opal > Tools > Registries > GA4, clicks More (…) for the GA4 entry, and clicks Delete.