The Amplitude Analytics connector tools in Optimizely Opal bridge your product analytics and AI-driven workflows to let you understand user behavior directly within Opal. Use these tools to perform complex event segmentation, analyze conversion funnels to identify drop-off points, and monitor long-term retention patterns. By centralizing these behavioral insights, marketing and product teams can make data-backed decisions to optimize digital experiences and drive business growth.
After you install and configure the Amplitude connector tools in Optimizely Connect Platform (OCP), they become available in Opal Chat, agents, and workflows.
Add the Amplitude Analytics Tool in OCP
Install the tool
In the OCP App Directory, complete the following:
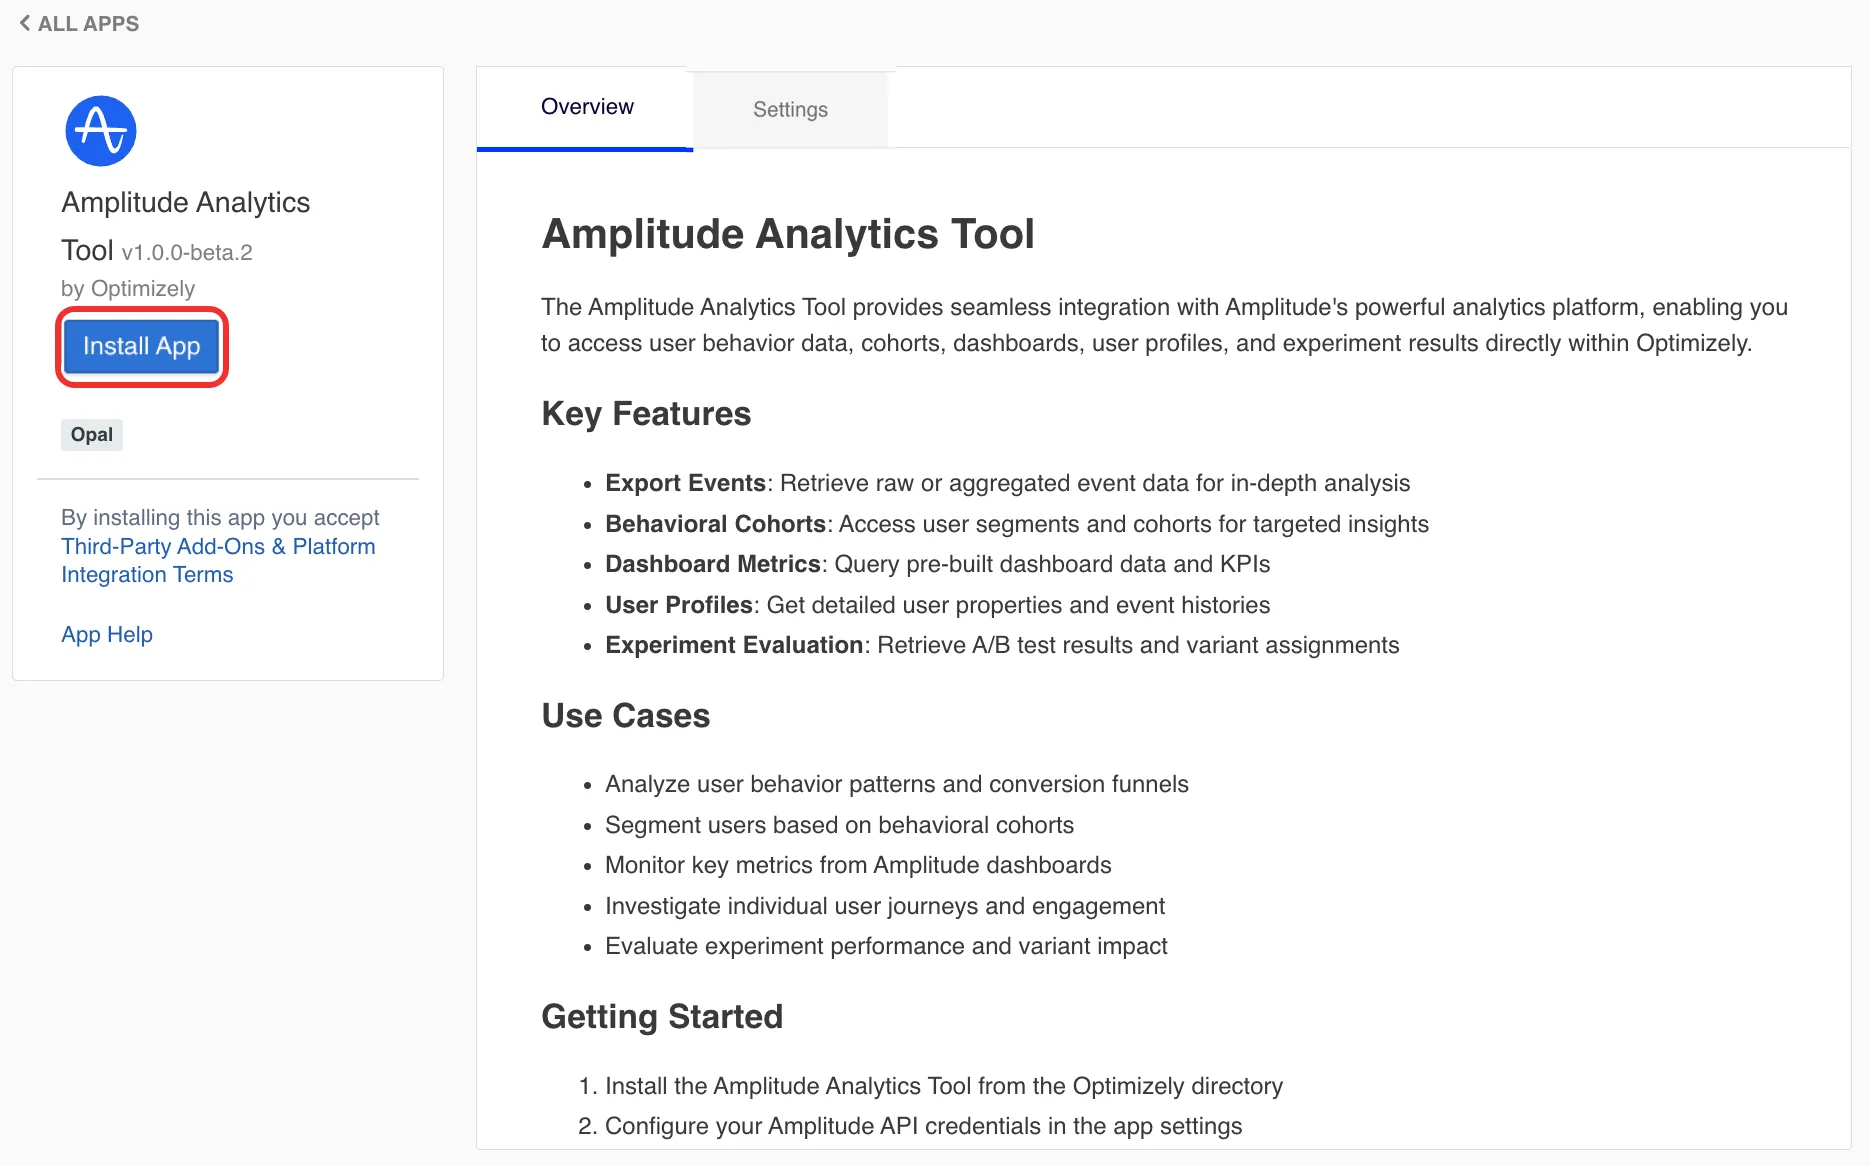
Click the Amplitude Analytics Tool.
Click InstallApp.
Copy your Amplitude Analytics API credentials
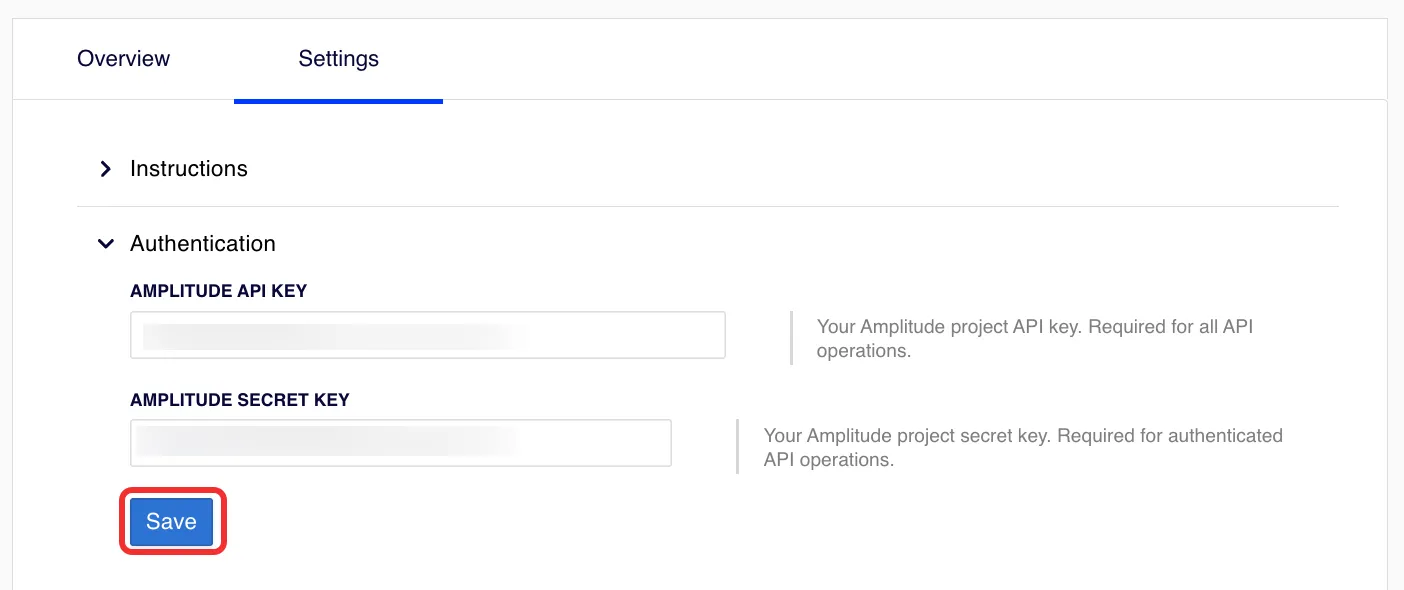
To enable Opal to access your Amplitude analytics data, use your Amplitude project's unique API key and secret key. For security reasons, you can copy secret keys only after they are generated. For information, see the Amplitude Analytics API documentation.
In the Amplitude Analytics Tool in the OCP App Directory, complete the following:
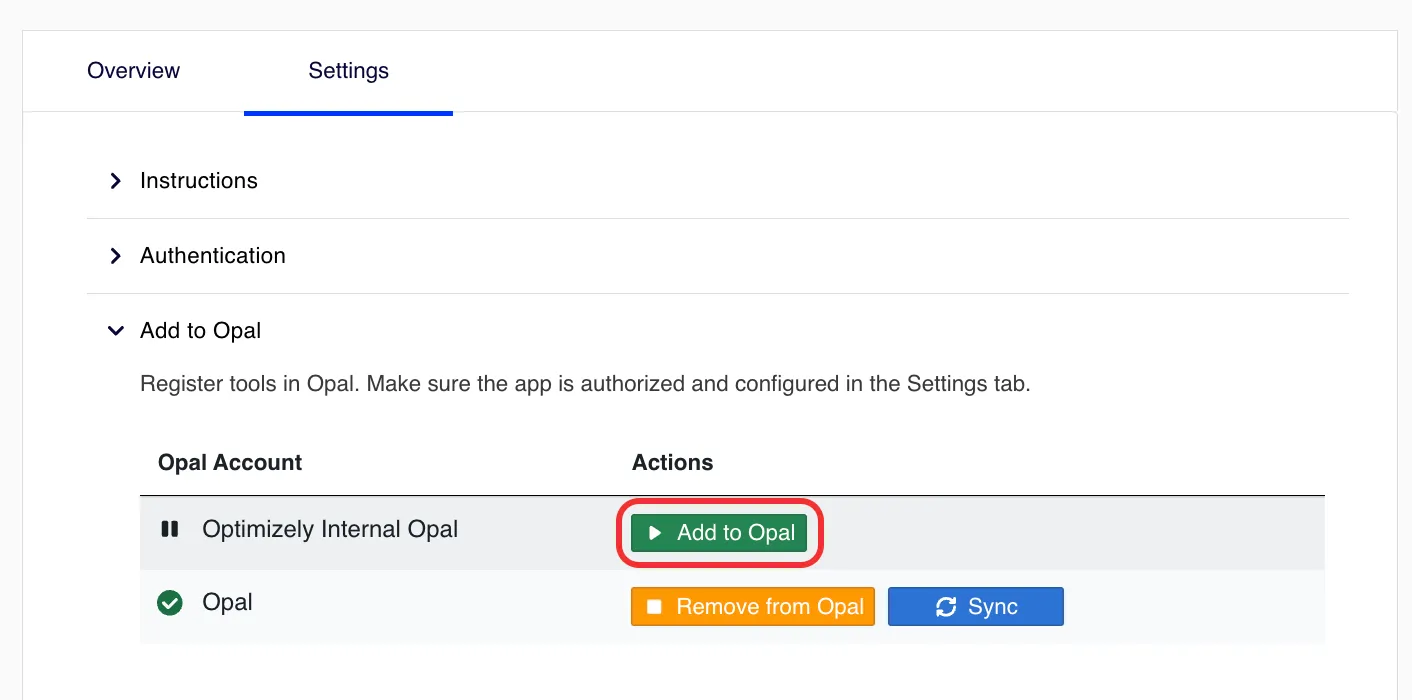
Expand the Add to Opal section.
Click Add to Opal to register the Amplitude Analytics Tool to the corresponding Opal instance.
Amplitude connector tools
After you add the Amplitude Analytics Tool in OCP, the following tools become available in Opal. Click on a tool's name to expand it and learn more about when to use the tool, required and optional parameters, and example prompts on how to call the tool. If you do not provide a required parameter, Opal prompts you for it.
When to use
To analyze how different user segments perform specific events over time.
To compare event frequency or conversion rates across various user properties.
To understand user behavior patterns and trends within an application or website.
Parameters
start – Start date for the analysis period in YYYYMMDD format (for example, "20240101" for January 1, 2024).
end – End date in YYYYMMDD format (for example, "20240131" for January 31, 2024).
event_type – The event name to analyze. Use "_active" for any user activity, or specific event names like "purchase_complete", "page_view", or "feature_click".
(Optional) metrics – Metric to calculate. Options include: "uniques" (unique users), "totals" (event count), "pct_dau" (percentage of daily active users). Default is "uniques".
(Optional) segmentBy – Property to segment results by (for example, "country", "device_type", or "user_type"). This breaks down the results by different user or event property value.
(Optional) interval – Time interval for data grouping. Options include the following: "1" (hourly), "7" (weekly), "30" (monthly). Default: Daily.
Example prompts
Show me the number of 'Add to Cart' events grouped by device type for the last 30 days.
How many users from the UK completed the 'Registration' event last week?
Segment the 'Video Play' event by subscription tier to see who watches more content.
When to use
Retrieve raw event data for individual user actions or behavioral analysis.
Export specific event types (like "purchase_complete" or "signup") for a defined time range.
Analyze successful purchases, feature usage, and other custom events within a specified timeframe.
Parameters
start – Start time for event export (ISO 8601 format or Unix timestamp in milliseconds). For example, "2024-01-01T00:00:00Z".
end – End time for event export (ISO 8601 format or Unix timestamp in milliseconds). For example, "2024-01-31T23:59:59Z".
(Optional) eventTypes – Array of specific event types to filter. For example, ["purchase_complete", "signup"].
Example prompts
Retrieve all events from Amplitude starting from 2024-01-01 to 2024-01-07.
Export "purchase_complete" and "checkout" events for the last 30 days from Amplitude.
Give me a raw export of all Amplitude events for the date ranges 1704067200000 to 1706745599000.
When to use
To optimize sign-up flows, purchase funnels, or onboarding sequences.
To measure how many users complete a specific sequence of actions. For example, "Visit → Add to Cart → Purchase".
To identify which step in a process has the highest drop-off rate.
Parameters
events – Array of event names defining the funnel steps in order. Minimum two events required. Example, ["page_view", "add_to_cart", "purchase_complete"].
start – Start date in YYYYMMDD format. Example, "20240101".
end – End date in YYYYMMDD format. Example, "20240131".
(Optional) conversionWindow – Time window for conversion in days. Users must complete all steps within this window. Default is 30 days.
(Optional) segmentBy – Property to segment funnel by (for example, "country" or "device_type") to see how different segments convert.
Example prompts
Analyze the funnel for "page_view", "sign_up", and "onboarding_complete" from 20240101 to 20240131.
Show me the conversion funnel for "add_to_cart" to "purchase_complete" for the last month, segmented by "device_type".
Run a funnel analysis for my checkout flow (view_cart, enter_shipping, payment_info, order_confirmed) with a 7-day conversion window.
When to use
To understand the size, properties, and definition of a specific user segment.
To identify cohort characteristics for targeted experimentation or analysis.
To retrieve a chart_id associated with a cohort for use in automated dashboards.
Parameters
cohortId – The unique identifier of the cohort to retrieve. This ID can be found in the Amplitude UI or retrieved from previous API calls. Example: "12345".
Example prompts
Get the details for the "High Value Customers" cohort with ID 78910.
Show me the definition and size of the "Churn Risk" cohort (ID: 45678).
Retrieve cohort information for ID 11223 to see its associated dashboard chart.
When to use
To quickly access pre-calculated metrics like daily active users, conversion rates, or retention from an existing Amplitude dashboard.
To pull KPI data for reports or presentations without manually running individual event queries.
To view the latest status of product performance metrics over a specific time range.
Parameters
dashboardId – The unique identifier of the dashboard to retrieve. This can be found in the Amplitude dashboard URL. Example, "abc-123-def".
(Optional) dateRange – The date range for the dashboard data. If not specified, Opal uses the dashboard's default range. Supported values, include the following: "last_7_days", "last_30_days", "this_month", or "last_month".
Example prompts
Get the data from my "Executive KPI" dashboard (ID: kpi-999) for the last 30 days.
Show me the metrics from Amplitude dashboard "Product Health" (ID: 456-789).
Retrieve the "User Growth" dashboard data for this month.
When to use
Fetch the current status and configuration of an experiment hosted in Amplitude.
Retrieve variation details and traffic allocation for a specific Amplitude experiment.
Verify the metadata of an experiment before linking it to an Optimizely campaign or report.
Parameters
experimentKey – The unique key or identifier of the experiment to retrieve. This is typically defined when creating the experiment in Amplitude.
(Optional) userId – The user ID to retrieve the specific variant assignment for that user. If not provided, Opal returns general experiment information.
Example prompts
Get the details for Amplitude experiment exp-999.
Show me the configuration for the experiment with ID amplitude-123.
Fetch the variation info for experiment 45678 from my Amplitude project.
When to use
Look up user properties and attributes for a specific user ID.
Check the current state of a user's profile before personalizing content.
Verify user segments or traits for troubleshooting.
What are the attributes for user ID 98765 in Amplitude?
When to use
Browse available user segments for targeting.
Find the ID of a specific cohort to use in other analysis tools.
Audit the list of active cohorts in the project.
Parameters
None
Example prompts
List all cohorts in Amplitude.
Show me the available user segments from Amplitude.
What cohorts do we have defined in our Amplitude project?
When to use
Identify which events are being tracked in the project.
Check the names of events to use in a query.
See a list of recent events for a specific category.
Parameters
None
Example prompts
List the event types tracked in Amplitude.
Show me the last 10 events from Amplitude.
What are the most common events in our project?
When to use
Check the status of ongoing experiments.
Find experiment IDs for reporting.
Review the list of experiments a user might be exposed to.
Parameters
(Optional) limit – Maximum number of experiments to return. Default, 100.
Example prompts
List all active experiments in Amplitude.
Show me the experiments currently running in Amplitude.
What experiments are defined in the Marketing project?
When to use
Measure user loyalty over time.
Compare retention rates between different cohorts.
Analyze the impact of a new feature on long-term engagement.
Parameters
startEvent – Initial event that defines the cohort (for instance, "sign_up" or "first_purchase"). Use "_active" to track retention of any active users.
start – Start date in YYYYMMDD format. For example, "20240101".
end – End date in YYYYMMDD format. For example, "20240131".
returnEvent – The event users must perform to be counted as retained (for example, "app_open" or "purchase"). Use "_active" to count any user activity as retention.
(Optional) retentionType – Type of retention to measure. Options include, "n_day" (specific day) or "bracket" (time ranges). Default is "bracket".
(Optional) segmentBy – Property to segment retention by. For example, "country" or "user_type".
Example prompts
Show me retention for users who performed 'Sign Up'.
What is the 30-day retention for the 'New Users' cohort?
Analyze retention from 'App Open' to 'Purchase' for the last month.
When to use
Debug a specific user's journey through the application.
Understand the sequence of actions leading to a conversion or drop-off.
Audit user behavior for support or troubleshooting.
Parameters
user_id – (Required) The unique identifier for the user.
(Optional) limit – The maximum number of activities to return. Default is 100, max is 1000.
Find user properties, device information, and summary statistics of an Amplitude user.
Find user information before analyzing their activity.
Find user information before evaluating them for segments.
Parameters
userId – The user ID or Amplitude ID to search for. Can be your application's user ID, device ID, or Amplitude's internal ID.
Example prompts
Search for user alice-123 in Amplitude.
Find users with the property plan: premium.
Search for user ID 555-0199.
Use cases
Digital marketing teams – AI-powered campaign performance optimization
Digital marketing teams can use Opal to query Amplitude for campaign performance data. For example, they can ask Opal to analyze conversion funnels using the amplitude_funnel_analysis tool for specific campaigns, segmenting results by acquisition channel or user demographics using the amplitude_event_segmentation tool. Opal can then identify which channels or user segments are underperforming or overperforming.
Productivity – Instead of manually pulling reports and cross-referencing data, marketers can get instant, AI-summarized insights. Opal can automate the identification of trends and anomalies, freeing up time for strategic planning rather than data crunching.
Value – This leads to optimized marketing spend, higher conversion rates, and improved ROI. Opal can even suggest A/B test ideas for landing pages or calls-to-action based on behavioral patterns, directly impacting campaign effectiveness.
Digital experimentation teams – accelerated A/B test analysis and iteration
Experimentation teams can use Opal to analyze the results of A/B tests run through Optimizely, with user behavior data flowing into Amplitude. Opal can query the amplitude_get_experiment tool to retrieve experiment details and then use the amplitude_event_segmentation and amplitude_funnel_analysis tools to compare variant performance across key metrics and user segments.
Executive leaders – strategic performance overview and anomaly detection
Executive leaders can ask Opal for high-level summaries of business performance. Opal can access pre-built Amplitude dashboards using the amplitude_get_dashboard tool or perform ad-hoc segmentation using the amplitude_event_segmentation tool on critical KPIs like daily active users, conversion rates, or retention. You can configure Opal to proactively flag significant shifts or anomalies in these metrics.
Cross-functional teams – Proactive user retention and churn prediction
Product, marketing, and experimentation teams can collaborate with Opal to understand user retention. Opal can perform an amplitude_retention_analysis to identify drop-off points and then use the amplitude_user_search or amplitude_get_cohort tools to analyze the characteristics of users who churn or become highly engaged.