Ratio metric
In Warehouse-Native Experimentation Analytics, a ratio metric divides the values of two events to produce a single derived value. You can use it to measure derived rates such as content completion rate, revenue per session, or items purchased per visit.
To measure a single metric value instead of a ratio, see Numeric aggregation metrics or Conversion metrics.
Example use case
On a streaming platform such as Flix, you can use a ratio metric to measure how effectively user engagement translates into revenue. Configure the metric as follows:
- Numerator – Total Time Viewed
- Denominator – Total Revenue
A higher ratio suggests strong viewer retention relative to earnings. A lower ratio points to opportunities to improve monetization.
Add and configure ratio metric
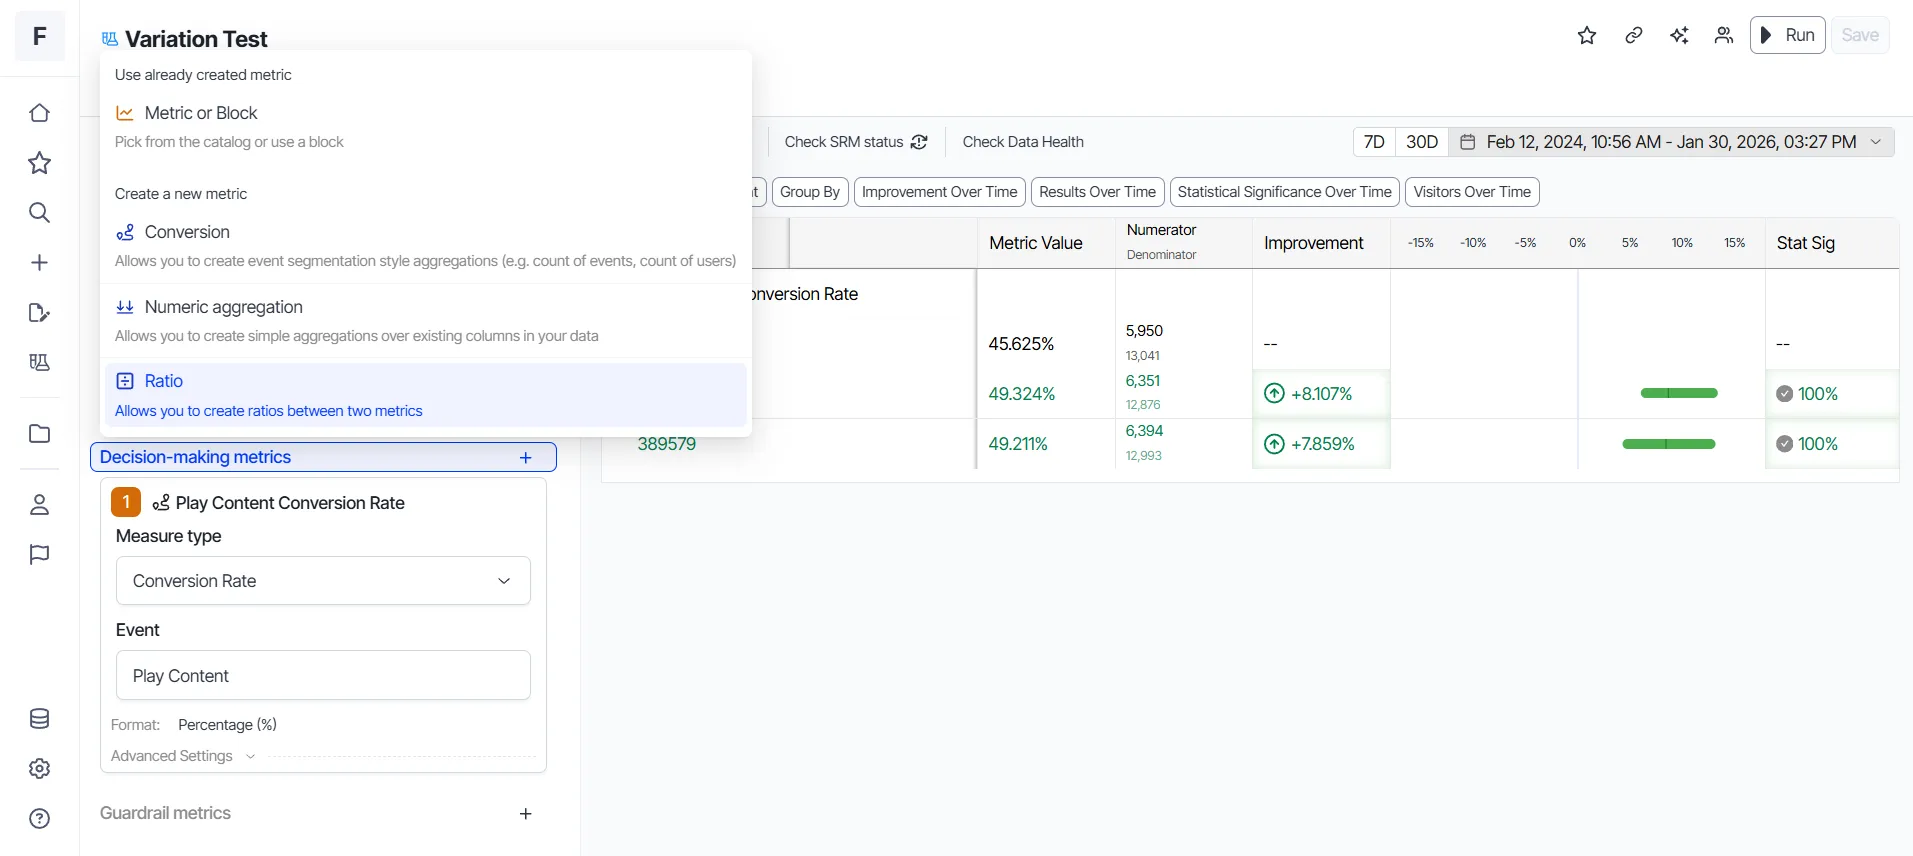
To add a conversion metric, click Add a decision making metric > Ratio.
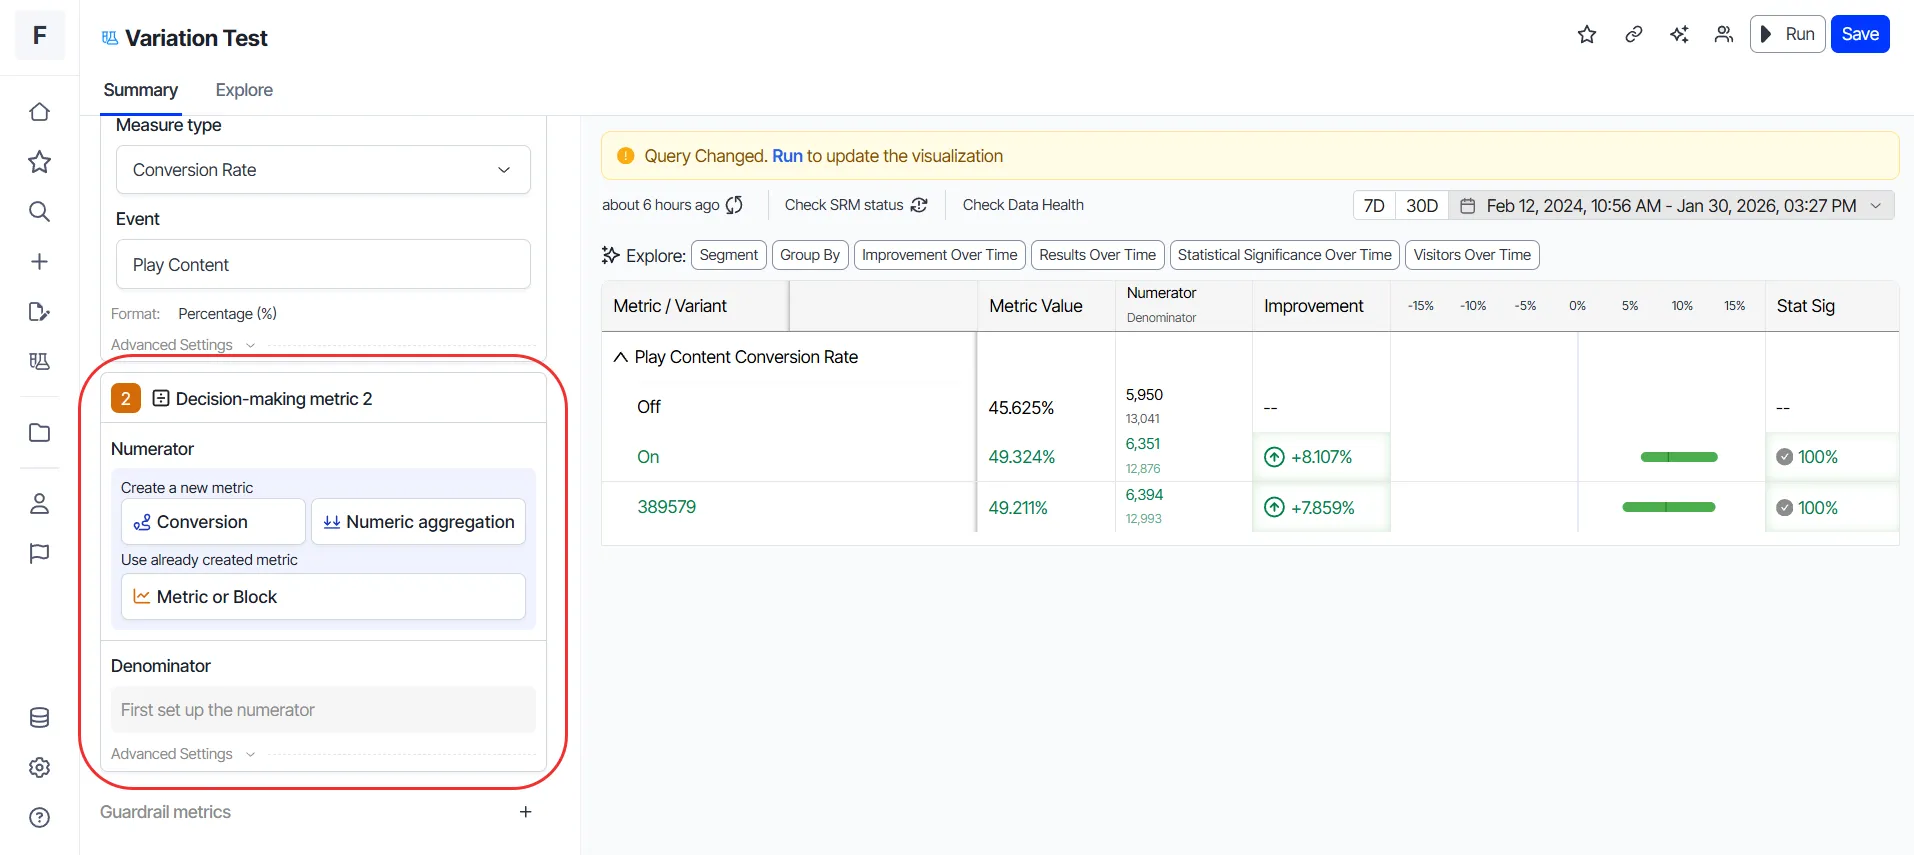
In the ratio metric block, define a numerator and a denominator. The system calculates each value separately, then divides the numerator by the denominator to produce the ratio.
Set the numerator
Choose one of the following for the numerator:
- Create a conversion metric.
- Create a numeric aggregation metric.
- Select an existing metric.
Set the denominator
Choose one of the following for the denominator:
- Create a conversion metric.
- Create a numeric aggregation metric.
- Select an existing metric.
Statistical methodology
When you run experiments with ratio metrics, you must estimate the metric's variance to determine its statistical significance. A ratio metric divides two events. Optimizely uses a first-order Taylor series approximation (often called the Delta method) to estimate the variance.
For a ratio metric R̂ defined as,
\hat{R} = \frac{\sum_{i=1}^{n} y_i}{\sum_{i=1}^{n} x_i}Where
- x_i represents the observed values of the denominator event
- y_i represents the observed values of the numerator event
The approximate variance ofR̂is calculated as,
\mathrm{V}(\hat{R}) \approx \frac{1}{n} \cdot \frac{1}{\mu_x^2} \left( R^2 \sigma_x^2 + \sigma_y^2 - 2R\sigma_{xy} \right)Where
- n is the sample size.
- \mu_x is the mean of the denominator variable.
- \sigma_x^2 is the variance ofx.
- \sigma_y^2 is the variance ofy.
- \sigma_{xy} is the covariance betweenxand y.
This approximation helps you understand the variability of the ratio metric, which is crucial for hypothesis testing. The covariance \sigma_{xy} in the formula indicates that the two events in a ratio metric may not be independent. Instead, their values may be statistically dependent, meaning that changes in one event could be correlated with changes in the other. This dependence is captured in the variance calculation to ensure accurate statistical inferences. Optimizely's sequential testing methods were adjusted to account for this variance estimation, ensuring accurate and reliable test results.