New A/B Results page Diagnostics tab
Use the Diagnostics tab to confirm that an experiment reaches users and records conversions before you trust its results. The tab shows the raw decision and conversion events behind the experiment and checks the integrity of its data.
The tab helps when results look wrong, like a variation with no traffic or a metric stuck at zero. Check the underlying events directly instead of guessing at the cause.
The tab shows the following types of events:
- Decision events – Record each time Optimizely assigns an actor to a variation, a process called bucketing. An actor is the user or other entity that the experiment measures.
- Behavioral / Conversion events – Record the events that each actor fires. Metrics on the experiment count these events. See Difference between events and metricsDifference between events and metrics.
The tab only shows conversion events from actors that have at least one decision event for the experiment. The selected time range applies to both. For example, with Last Hour selected, the tab shows only conversions from actors that Optimizely bucketed in the last hour.
Open the Diagnostics tab
To open the tab, complete the following steps:
- Open the experiment results page.
- In Analytics, go to Experiments and click an experiment.
- In Web Experimentation or Feature Experimentation, open the New A/B Results page. See Access experiment resultsAccess experiment results.
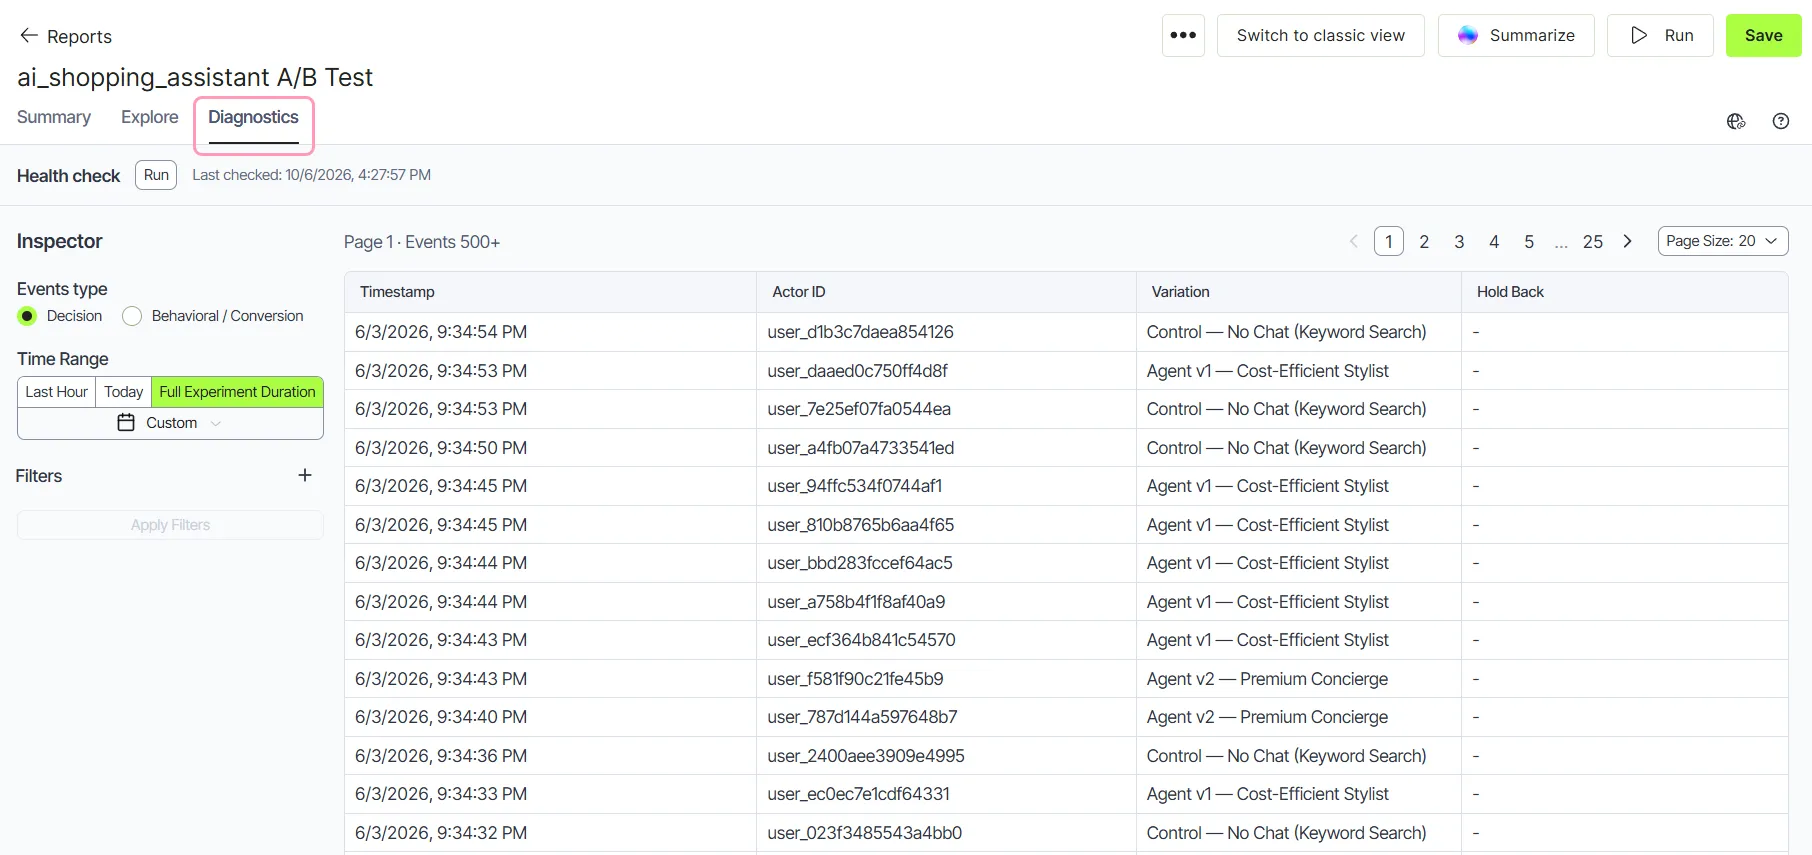
- Click the Diagnostics tab.
The Diagnostics tab does not display when you view experiment results through a public link.
The Diagnostics tab has the following areas:
- Health check – Runs data-integrity checks on the experiment and shows when they last ran.
- Inspector – Controls which events the event table shows.
- Event table – Lists the events that match your inspector selections.
When you open the tab, the event table shows decision events for the full duration of the experiment.
Run a health check
Run the health check to catch data problems that skew experiment results. It runs the following checks:
- Actor dataset PK uniqueness
- Actor identifier alignment
- Single variation per actor
For check details and status meanings, see Health check overview.
The health check runs against the experiment scorecard. Your inspector selections, including the time range, filters, and Events selection, do not affect it.
To run the health check, click Run in the Health check section. The Health check window displays the result of each check. The Last checked timestamp shows when the checks last ran.
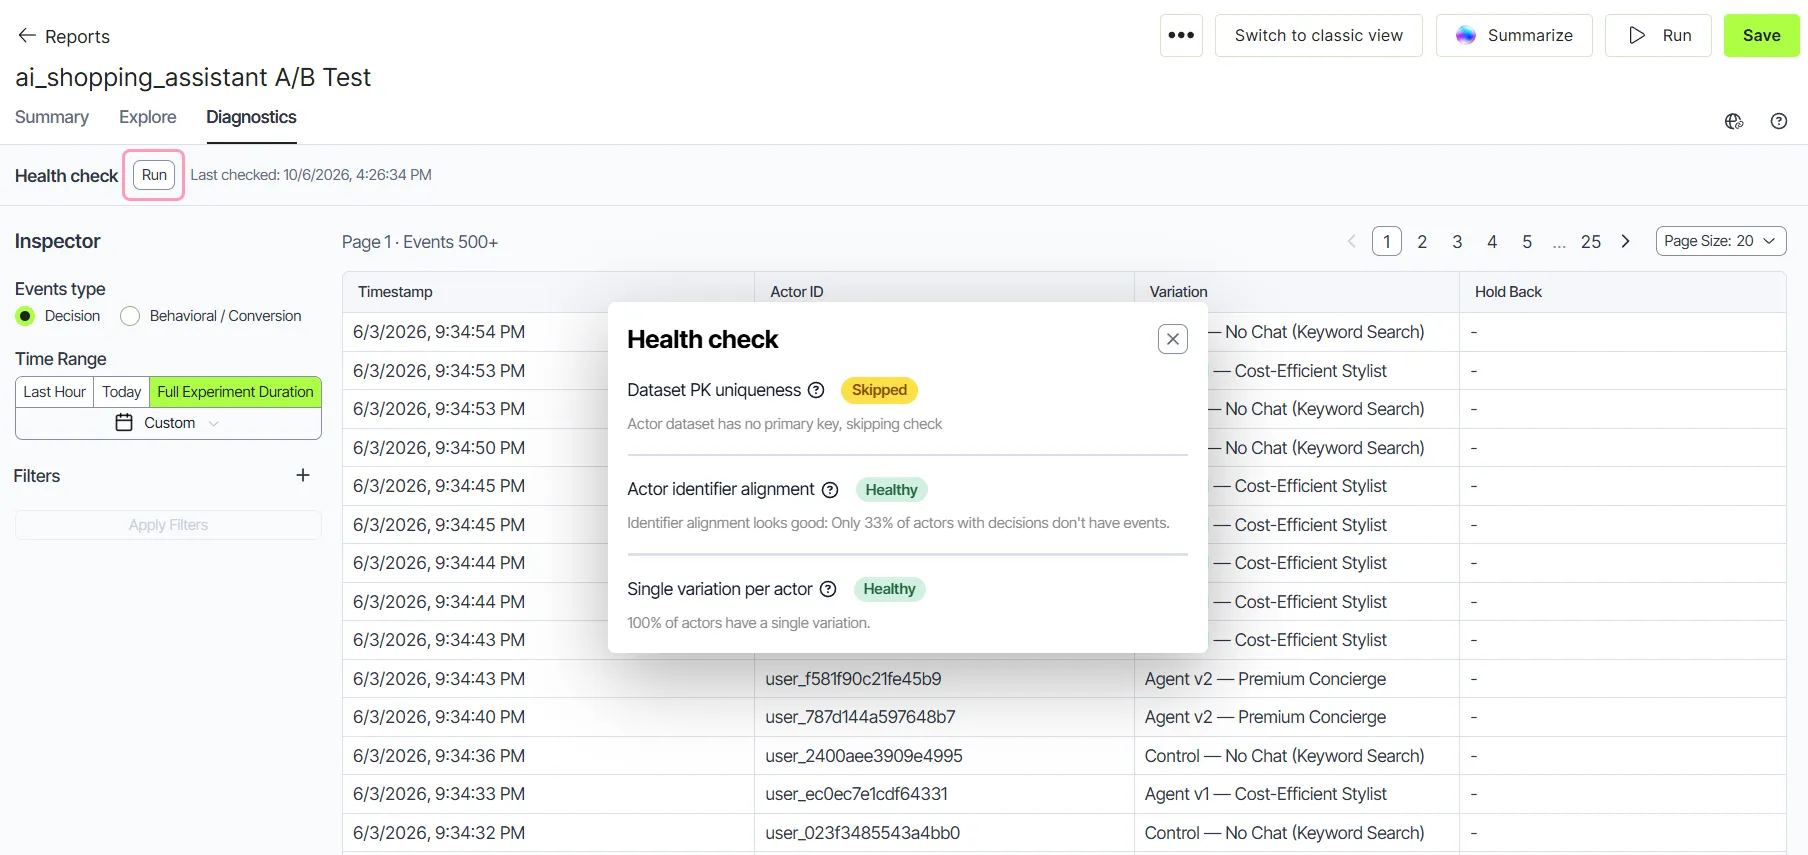
For experiments that use Optimizely-hosted data, the health check also runs automatically when you open the tab. The automatic run only fills in the Last checked timestamp and does not open the Health check window. To view the results, click Run. This runs the checks again and opens the window.
For warehouse-native experiments, Last checked stays empty until you click Run.
The Last checked timestamp is not saved. It clears when you reload the page.
Inspect events
To inspect the events for an experiment, complete the following steps:
- Under Events type, select Decision or Behavioral / Conversion.
- (Conversion events only) In the Events drop-down list, select the events to show. To show every conversion event, clear your selections. The list shows All events when nothing is selected.
- Under Time Range, select a range.
- (Optional) Click Filters to add a filter.
- (Optional) Define one or more conditions. Each condition sets an event field, an operator, and a value.
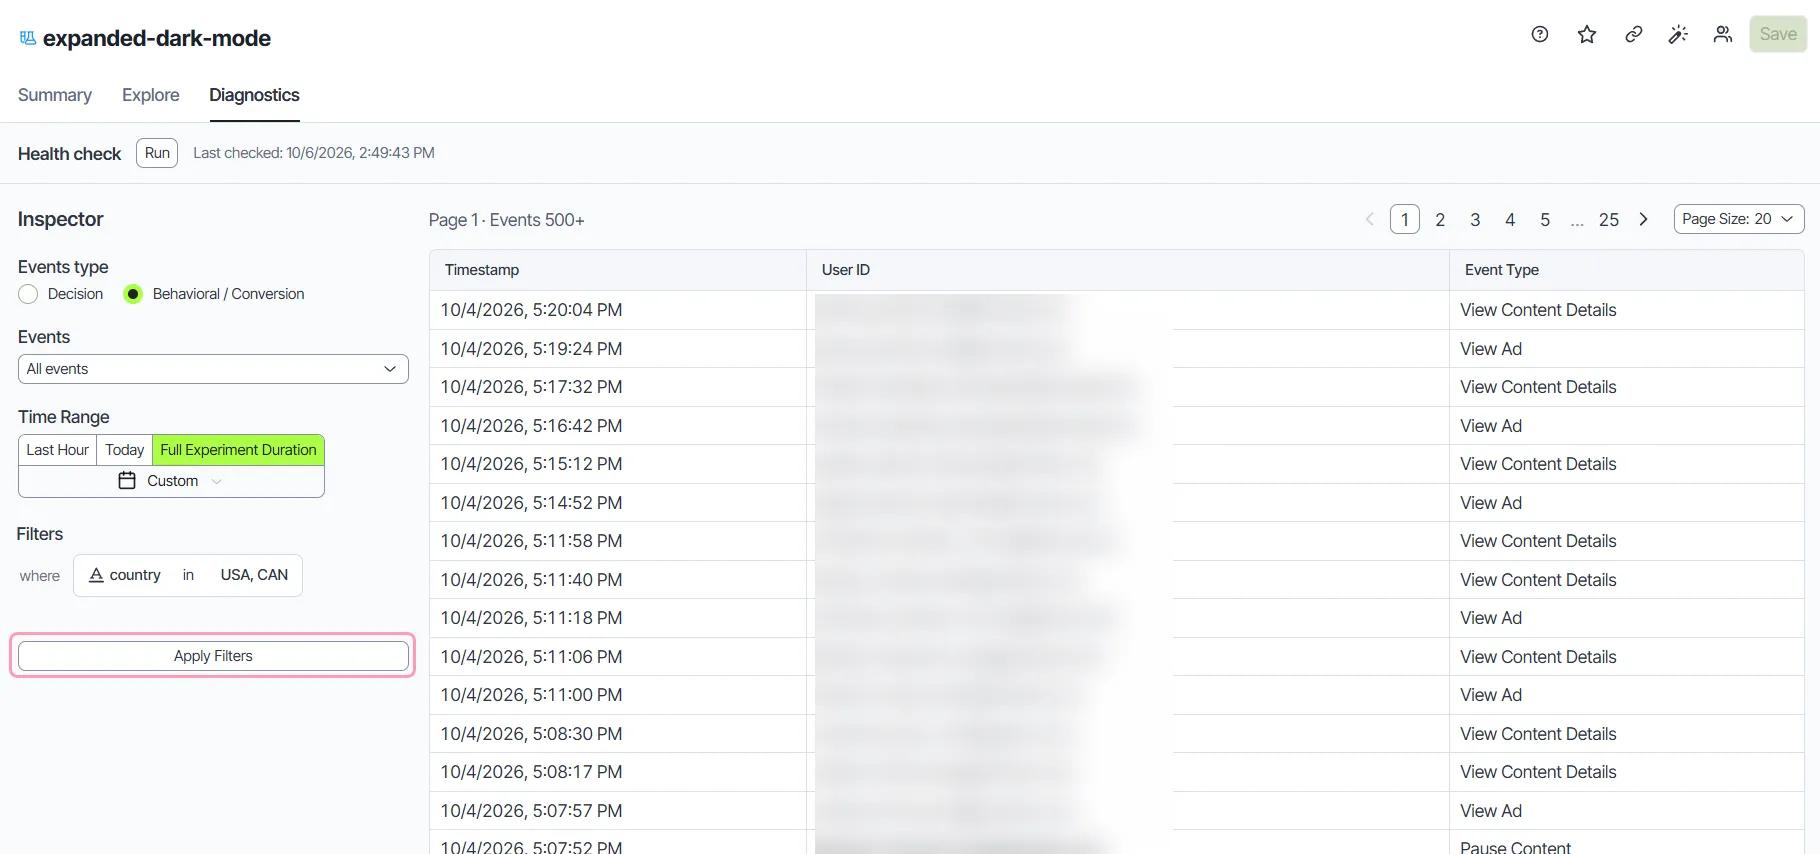
- (Optional) Click Apply Filters.
- Review the events in the event table.
The event table updates when you change the Events selection. Filter changes apply only when you click Apply Filters.
Switching between Decision and Behavioral / Conversion clears your filters and your Events selection. The two event types have different fields.
Choose a time range
The Time Range control has three presets and a custom date picker:
- Last Hour – Shows events from the last 60 minutes. You can use it to confirm that events arrive right after you start an experiment.
- Today – Shows events since the start of the current day.
- Full Experiment Duration – Shows events from the experiment start date to its end date. For a running experiment, the range ends at the time you opened the tab. This range is the default.
- Custom – Shows events for a range that you set. Click Custom, then set a range on one of the following tabs:
- Last – A rolling window, like the last 7 days.
- Range – A start date and an end date.
- Since – A start date until now.
To return to the default range from Last Hour or Today, click the selected preset again.
Full Experiment Duration is unavailable for a draft experiment that has not started. For these experiments, the tab shows events from the last 30 days.
Event table columns
Timestamps in the event table display in the time zone of the app.
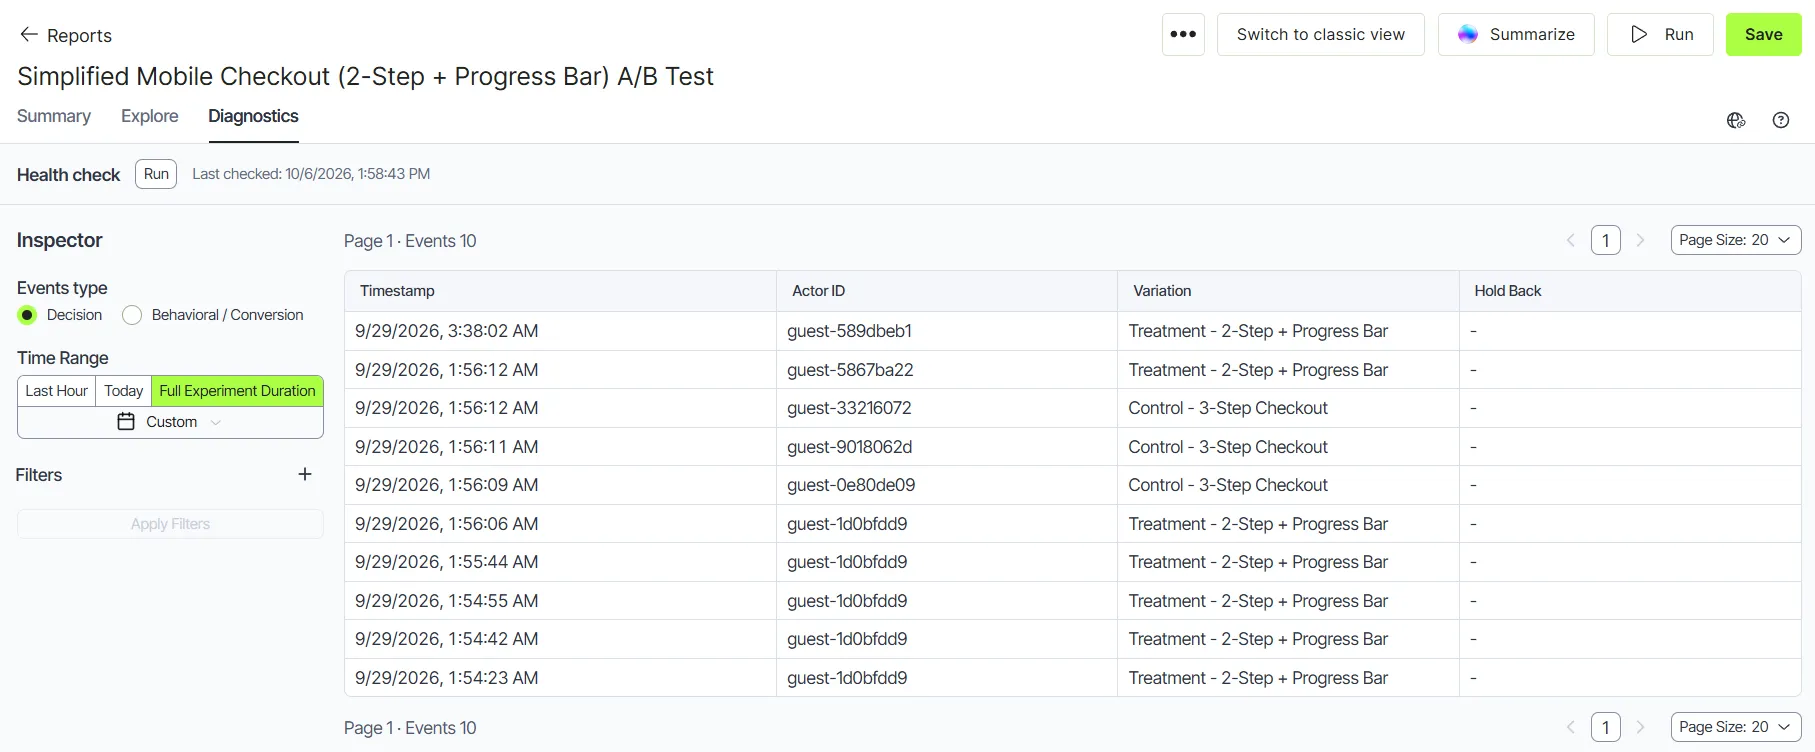
For experiments that use Optimizely-hosted data, including Web Experimentation and Feature Experimentation experiments, the event table shows fixed columns. Decision events show the following columns:
- Timestamp – The time of the decision.
- Actor ID – The identifier of the actor that received the decision.
- Variation – The variation that Optimizely assigned to the actor.
- Hold Back – Shows yes if Optimizely held the actor back from the experiment, and - otherwise.
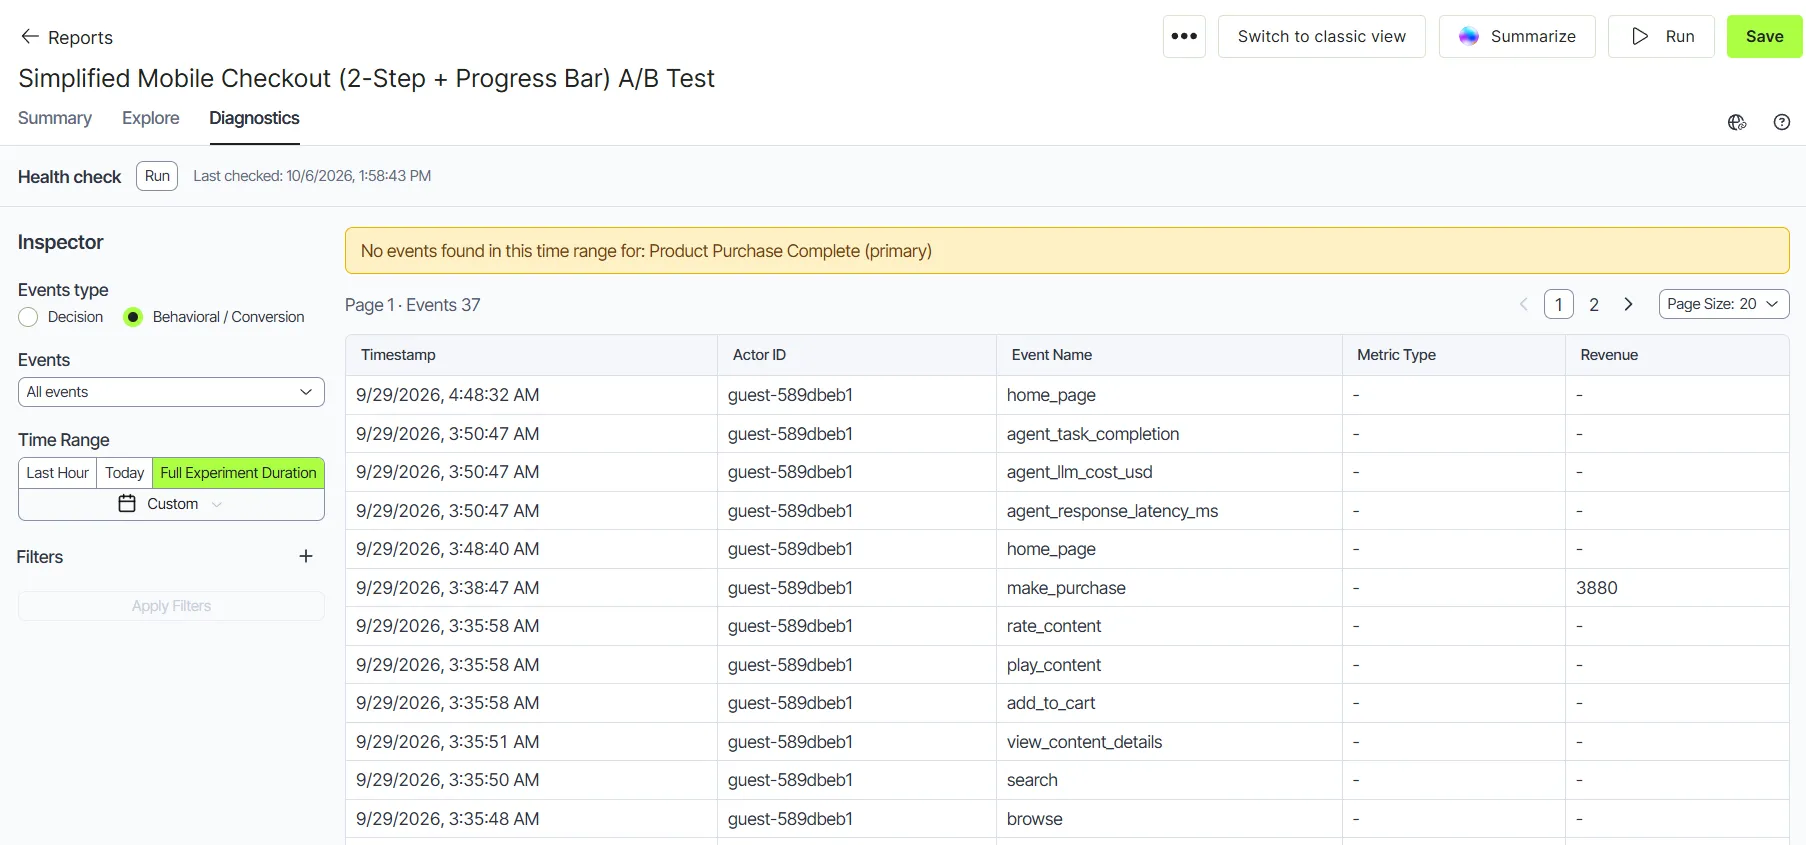
Behavioral / Conversion events show the following columns:
- Timestamp – The time of the event.
- Actor ID – The identifier of the actor that fired the event.
- Event Name – The event that the actor fired.
- Metric Type – Shows Primary for the primary metric, Guardrail for any other experiment metric, or - if the event is not a metric event.
- Revenue – The revenue value that the event carries, if any.
For warehouse-native experiments, the columns come from your datasets:
- Decision events – Show the timestamp, actor ID, variation, and holdback columns that you mapped on the decision dataset. See Create a decision dataset in Analytics.
- Behavioral / Conversion events – Show the timestamp, actor ID, and attribute columns of the default event stream for the app. The default event stream is not always the dataset that the experiment metrics use.
Column headers come from the column names. For example, a user_id column displays as User ID.
Page through events
The event table shows 20 events per page. To show more events on each page, select 50 or 100 in Page Size. The event count shows the current page and the total number of events.
The tab loads the 500 most recent events that match your selections. If the event count shows 500+, more events match your selections than the tab can show. Shorten the time range or add filters to see a smaller, complete set.
View event details
For conversion events, click a row in the event table to open the event detail panel. Decision event rows do not open a detail panel.
What the panel shows depends on where the experiment data lives:
- Optimizely-hosted data – The panel lists every field on the raw event. Nested JavaScript Object Notation (JSON) data displays in expandable sections.
- Warehouse-native experiments – The panel shows only the columns of the row that you clicked.
To find a field, use the following options:
- Search – Shows only the fields whose name or value matches the text you enter.
- Hide null values – Hides fields that have no value. This option is on by default.
Status messages
The Diagnostics tab shows messages that help you tell expected gaps from real problems:
- Experiment not started — no decision data is expected yet. – The experiment has not started, so the tab has no decision events to show.
- Experiment paused — decision events may have stopped flowing. – The experiment is paused. Expect few or no new decision events.
- No events found in this time range for: – (Behavioral / Conversion only) Lists each experiment metric that has no conversion events in the selected time range. Each metric shows its type in lowercase in parentheses, like Checkout (primary). This message checks only the time range and ignores your filters and Events selection.
- No events match your current filters or selected time range. – The table is empty after you add a filter, select events, or narrow the time range. Widen the time range or remove filters.
- For the event inspector to show the listing you need to: 1. Select which metrics you want to inspect events from 2. Run the inspector – The table is empty, and you have not added a filter, selected events, or narrowed the time range.
The not-started and paused messages display only for experiments that use Optimizely-hosted data, because they come from the Optimizely experiment status. Warehouse-native experiments do not show them.
To learn how pausing affects events, see the following articles:
- Events from paused experiments, stopped variations, and archived experimentsEvents from paused experiments, stopped variations, and archived experiments.
Troubleshoot an experiment
Use the following checks when results look wrong:
- Results are empty after launch – Select Decision and click Last Hour. If no decision events display, confirm that the experiment is running and that your application sends decision events. See Check event firing in a live experiment or campaignCheck event firing in a live experiment or campaign for Web Experimentation or What are impressions and decisions in Feature Experimentation.
- A variation has no traffic – Select Decision and add a filter on the variation ID field, using the ID of the variation. The table shows variation names, but filters match on IDs. If no events match, review the traffic allocation for the experiment. See Possible causes for traffic imbalancesPossible causes for traffic imbalances.
- A metric stays at zero – Select Behavioral / Conversion and Full Experiment Duration. Shorter ranges only show conversions from actors that Optimizely bucketed in that range. Check whether the No events found in this time range for: message lists the metric. In the Events drop-down list, select the metric event to confirm whether your application sends it. See Metrics do not track correctlyMetrics do not track correctly for Web Experimentation or Track events in your application codeTrack events in your application code for Feature Experimentation.
- Actors display in decisions but not in conversions – Run the health check and review Actor identifier alignment. A large mismatch usually means that the decision and event datasets use different actor identifiers.