Build a Root Cause analysis
Build a Root Cause analysis to find out why a metric changed between two periods, filtered groups, or experiment variations. For an introduction to the template, see Root Cause overview.
Prerequisites
Confirm the following before you build a Root Cause analysis:
- Root Cause is on for your application. To turn it on, contact Optimizely Support.
- Your application connects to your data warehouse and has datasets, including an actor dataset such as Users.
- An additive metric exists for the change you want to explain. Additive metrics are counts or sums.
- To compare experiment variations, your application has an experiment with at least two variations.
Open the Root Cause template
Open Root Cause from the full template library to start an analysis.
- Click + > All Exploration templates.
- Click Root Cause.
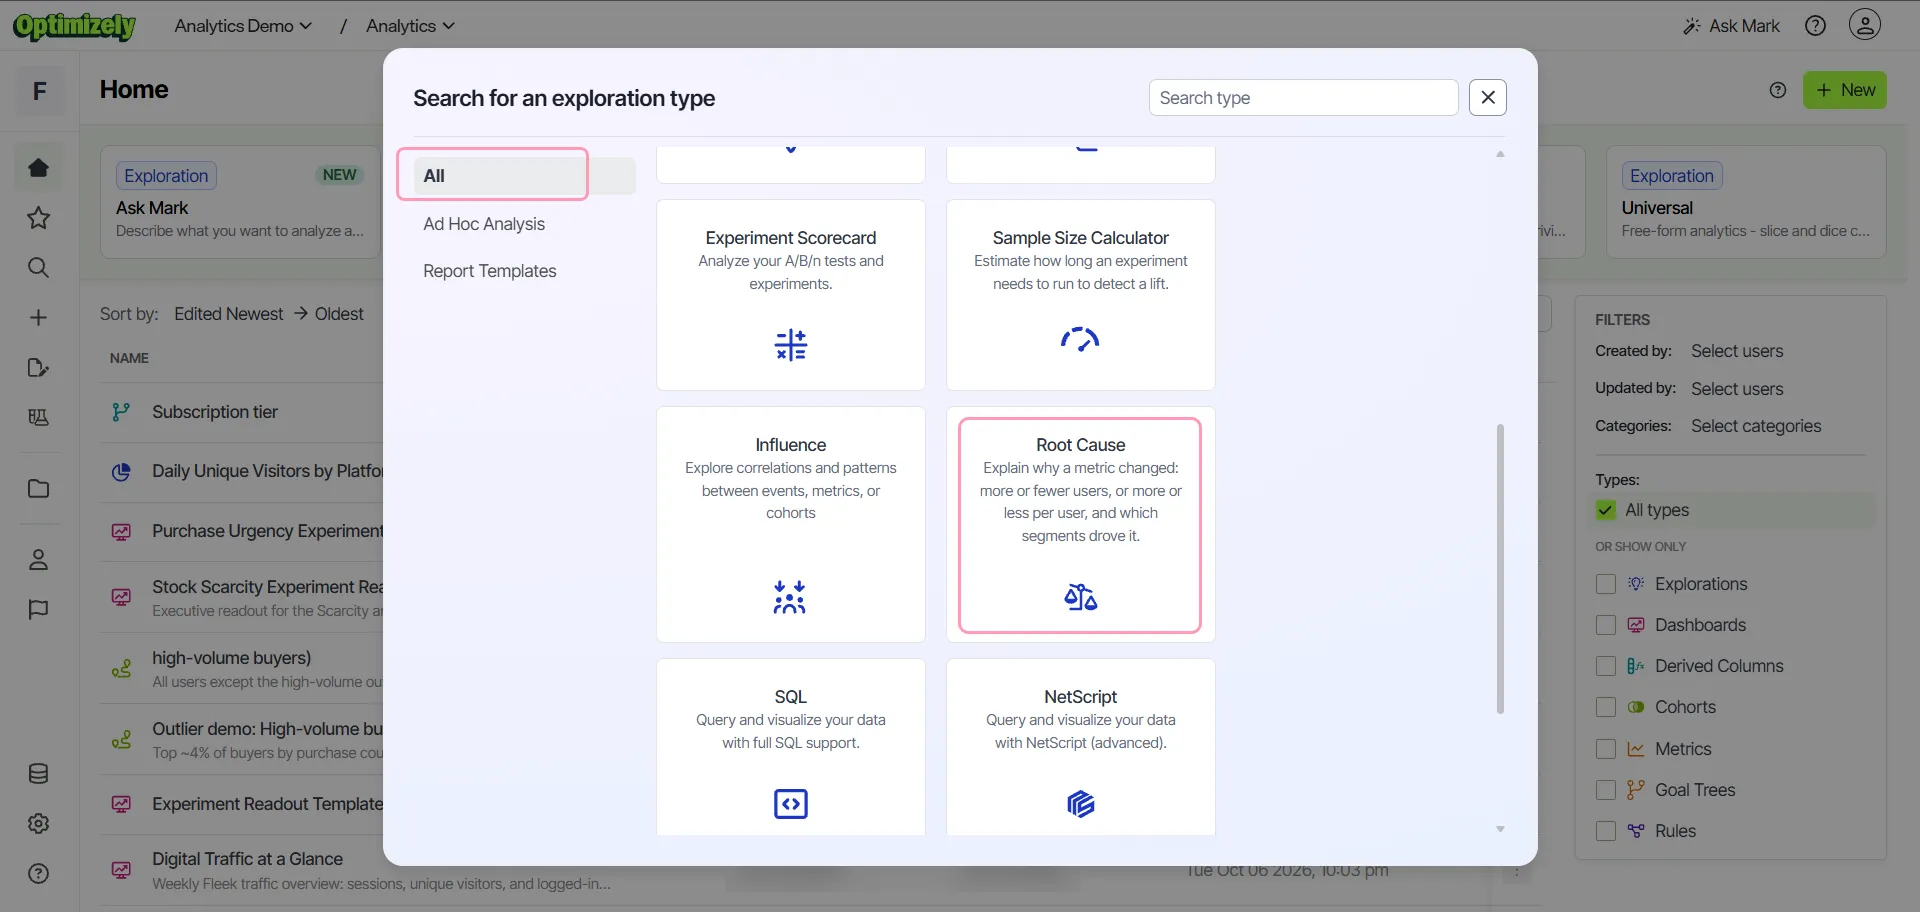
When your application settings define a default actor dataset, the editor starts with that actor. The comparison defaults to the last 28 full days, and the baseline defaults to the 28 days before that.
Choose the metric
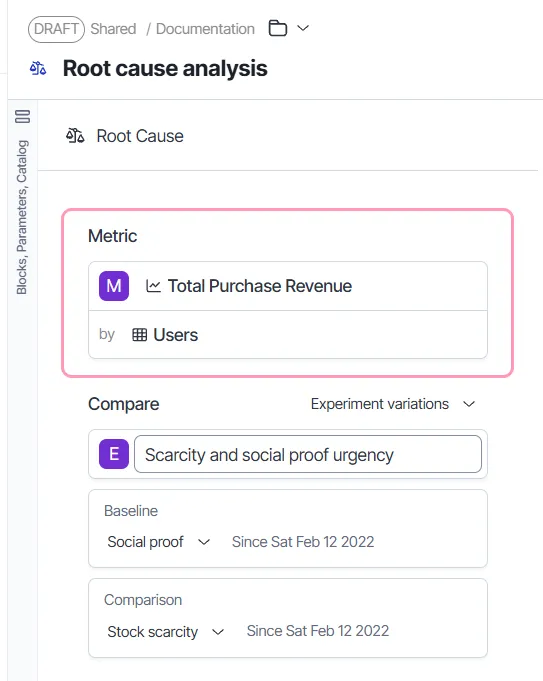
Choose the metric whose change you want to explain.
- In Metric, select the metric from the catalog or from a block.
- In by, select the actor dataset the metric counts over, such as Users.
Important
Root Cause accepts any metric, but it gives accurate results only for additive metrics, such as counts and sums. Results for other metrics, such as averages or ratios, are not accurate.
Choose what to compare
The Compare section defines the baseline and comparison populations whose difference Root Cause explains. Each population includes only users with at least one of the metric's events in its date range.
Compare two date ranges or filters
Use Time & filter to explain a change between two periods, or between two groups of users in the same period.
- In the Compare drop-down list, select Time & filter.
- In Baseline and Comparison, set the date ranges.
- (Optional) Add a filter to narrow the population.
Root Cause uses fixed dates, so a saved analysis keeps explaining the same difference. To compare two groups in the same period, give the two sides the same date range and different filters. See Filtering.
Compare experiment variations
Use Experiment variations to explain why one variation of an experiment produces more or less of a metric than another.
- In the Compare drop-down list, select Experiment variations.
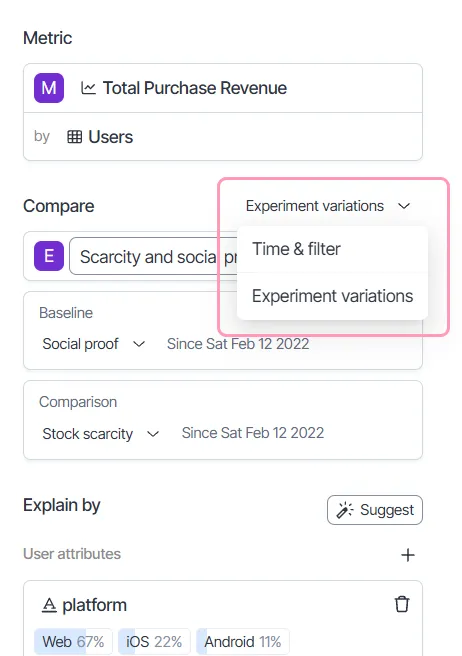
- Select the experiment.
- In Baseline and Comparison, select variations to compare.
- (Optional) Add a filter to a population.
Analytics sets both populations to the dates the experiment ran. Each population includes only the users exposed to its variation. Root Cause counts the events of those users from their first exposure on. It applies the same exposure logic as other experiment queries in Analytics.
Choose attributes and segments to explain by
The Explain by section lists the attributes and segments that Root Cause splits the change by. Choose attributes and segments that could explain the change, such as country, plan, or platform. Explain by groups them into the following kinds:
- User attributes – Attributes of the actor, such as the country of a user. It must belong to the actor dataset or to a joined dataset with at most one row per actor.
- Event attributes – Attributes of the metric's events, such as the device of each event. A user whose events have different values counts under each of those values.
- Segments – Membership in a cohort, which is a saved group of users. Root Cause splits users into those in the cohort and those not in it. Root Cause checks membership in the baseline period, including when you compare experiment variations.
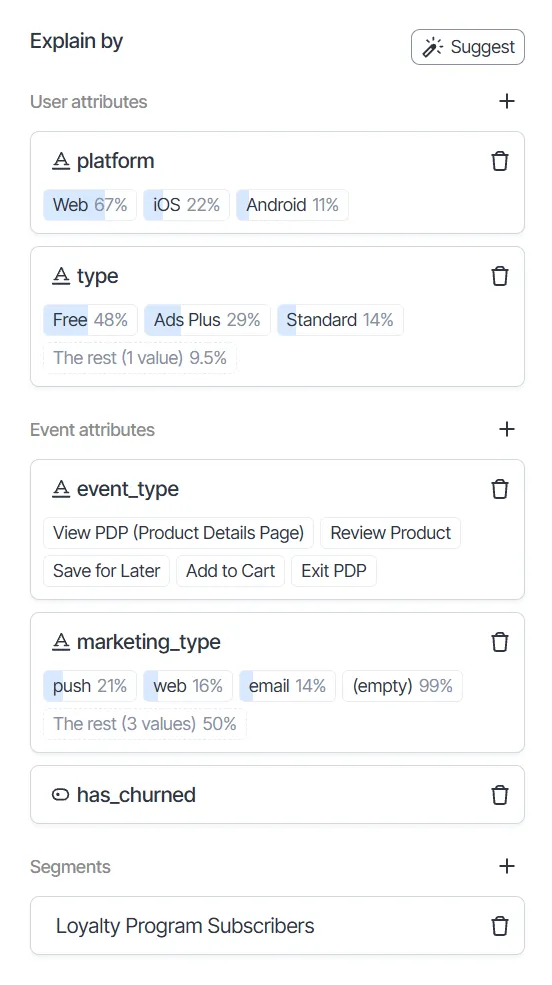
Each attribute lists the values that get their own row. Analytics groups every other value into The rest. To give empty values their own row, add the null value to the attribute.
Root Cause also combines up to three attributes or segments, such as country with plan, to find narrower segments.
Suggest attributes
Click Suggest to start from the attributes your application uses most. Suggest replaces the entire list, so click it before you add attributes or segments manually.
Suggest adds up to five user attributes and five event attributes, with the common values of each. Only text and true-or-false attributes qualify, except ones that look like IDs or keys. Suggest does not add segments.
Add attributes or segments manually
Add an attribute manually when Suggest did not choose it. Add every segment manually, because Suggest does not add segments.
- In Explain by, click Add user attributes, Add event attributes, or Add segments.
- Select the attribute or the segment. For an attribute, Analytics fills in its most frequent values.
To remove an attribute or segment, click Remove.
Run and save the analysis
Run the analysis to see the breakdown, then save it to revisit or share later.
- Click Run.
- Enter a descriptive name for the analysis.
- Click Save.
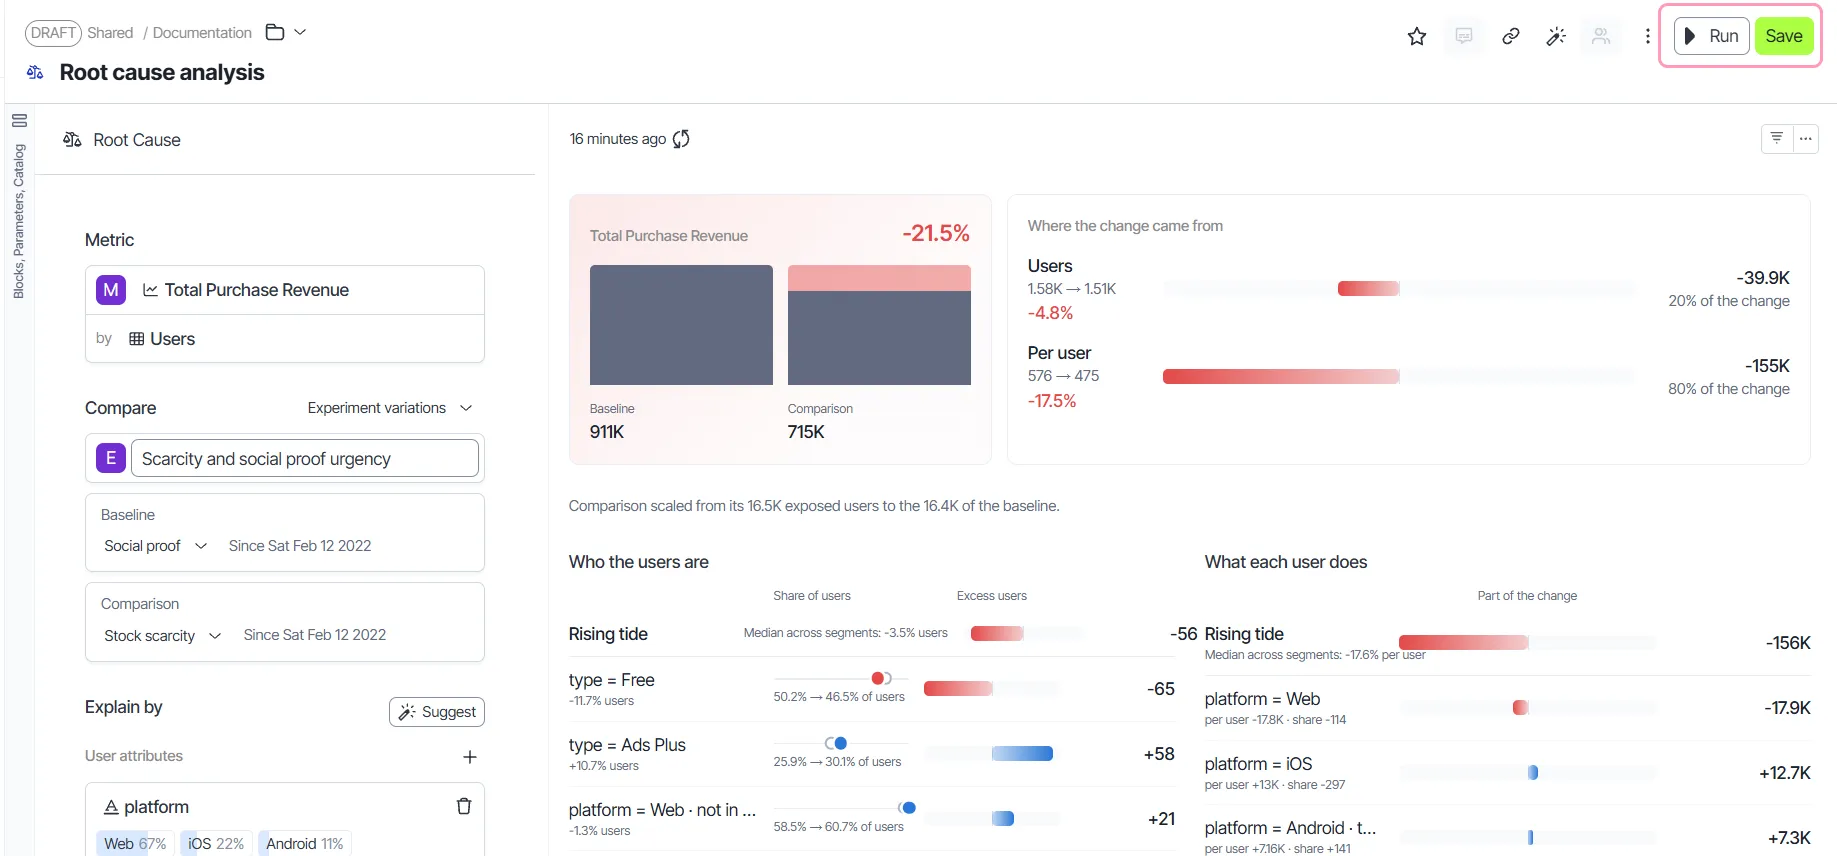
For information on reading the results, see Understand your Root Cause analysis.
Troubleshoot a Root Cause analysis
Root Cause checks the configuration before it runs the query. Most messages name the empty or duplicate setting to fix. Some messages refer to attributes and segments as dimensions. The following messages need more explanation:
- Not an attribute of the actor or a dataset it joins to. Add it as an event attribute instead. – A user attribute does not belong to the actor dataset or a dataset joined to it. Remove the attribute from User attributes and add it under Event attributes.
- Too many dimensions to combine. Remove some. – The attributes and segments produce more combinations than the query supports. Remove attributes or segments until the message clears.