Understand your Root Cause analysis
A Root Cause analysis breaks the change in a metric into parts, so you know where to focus. The results call each actor a user, whatever actor dataset the analysis counts over. To configure an analysis, go to Build a Root Cause analysis.
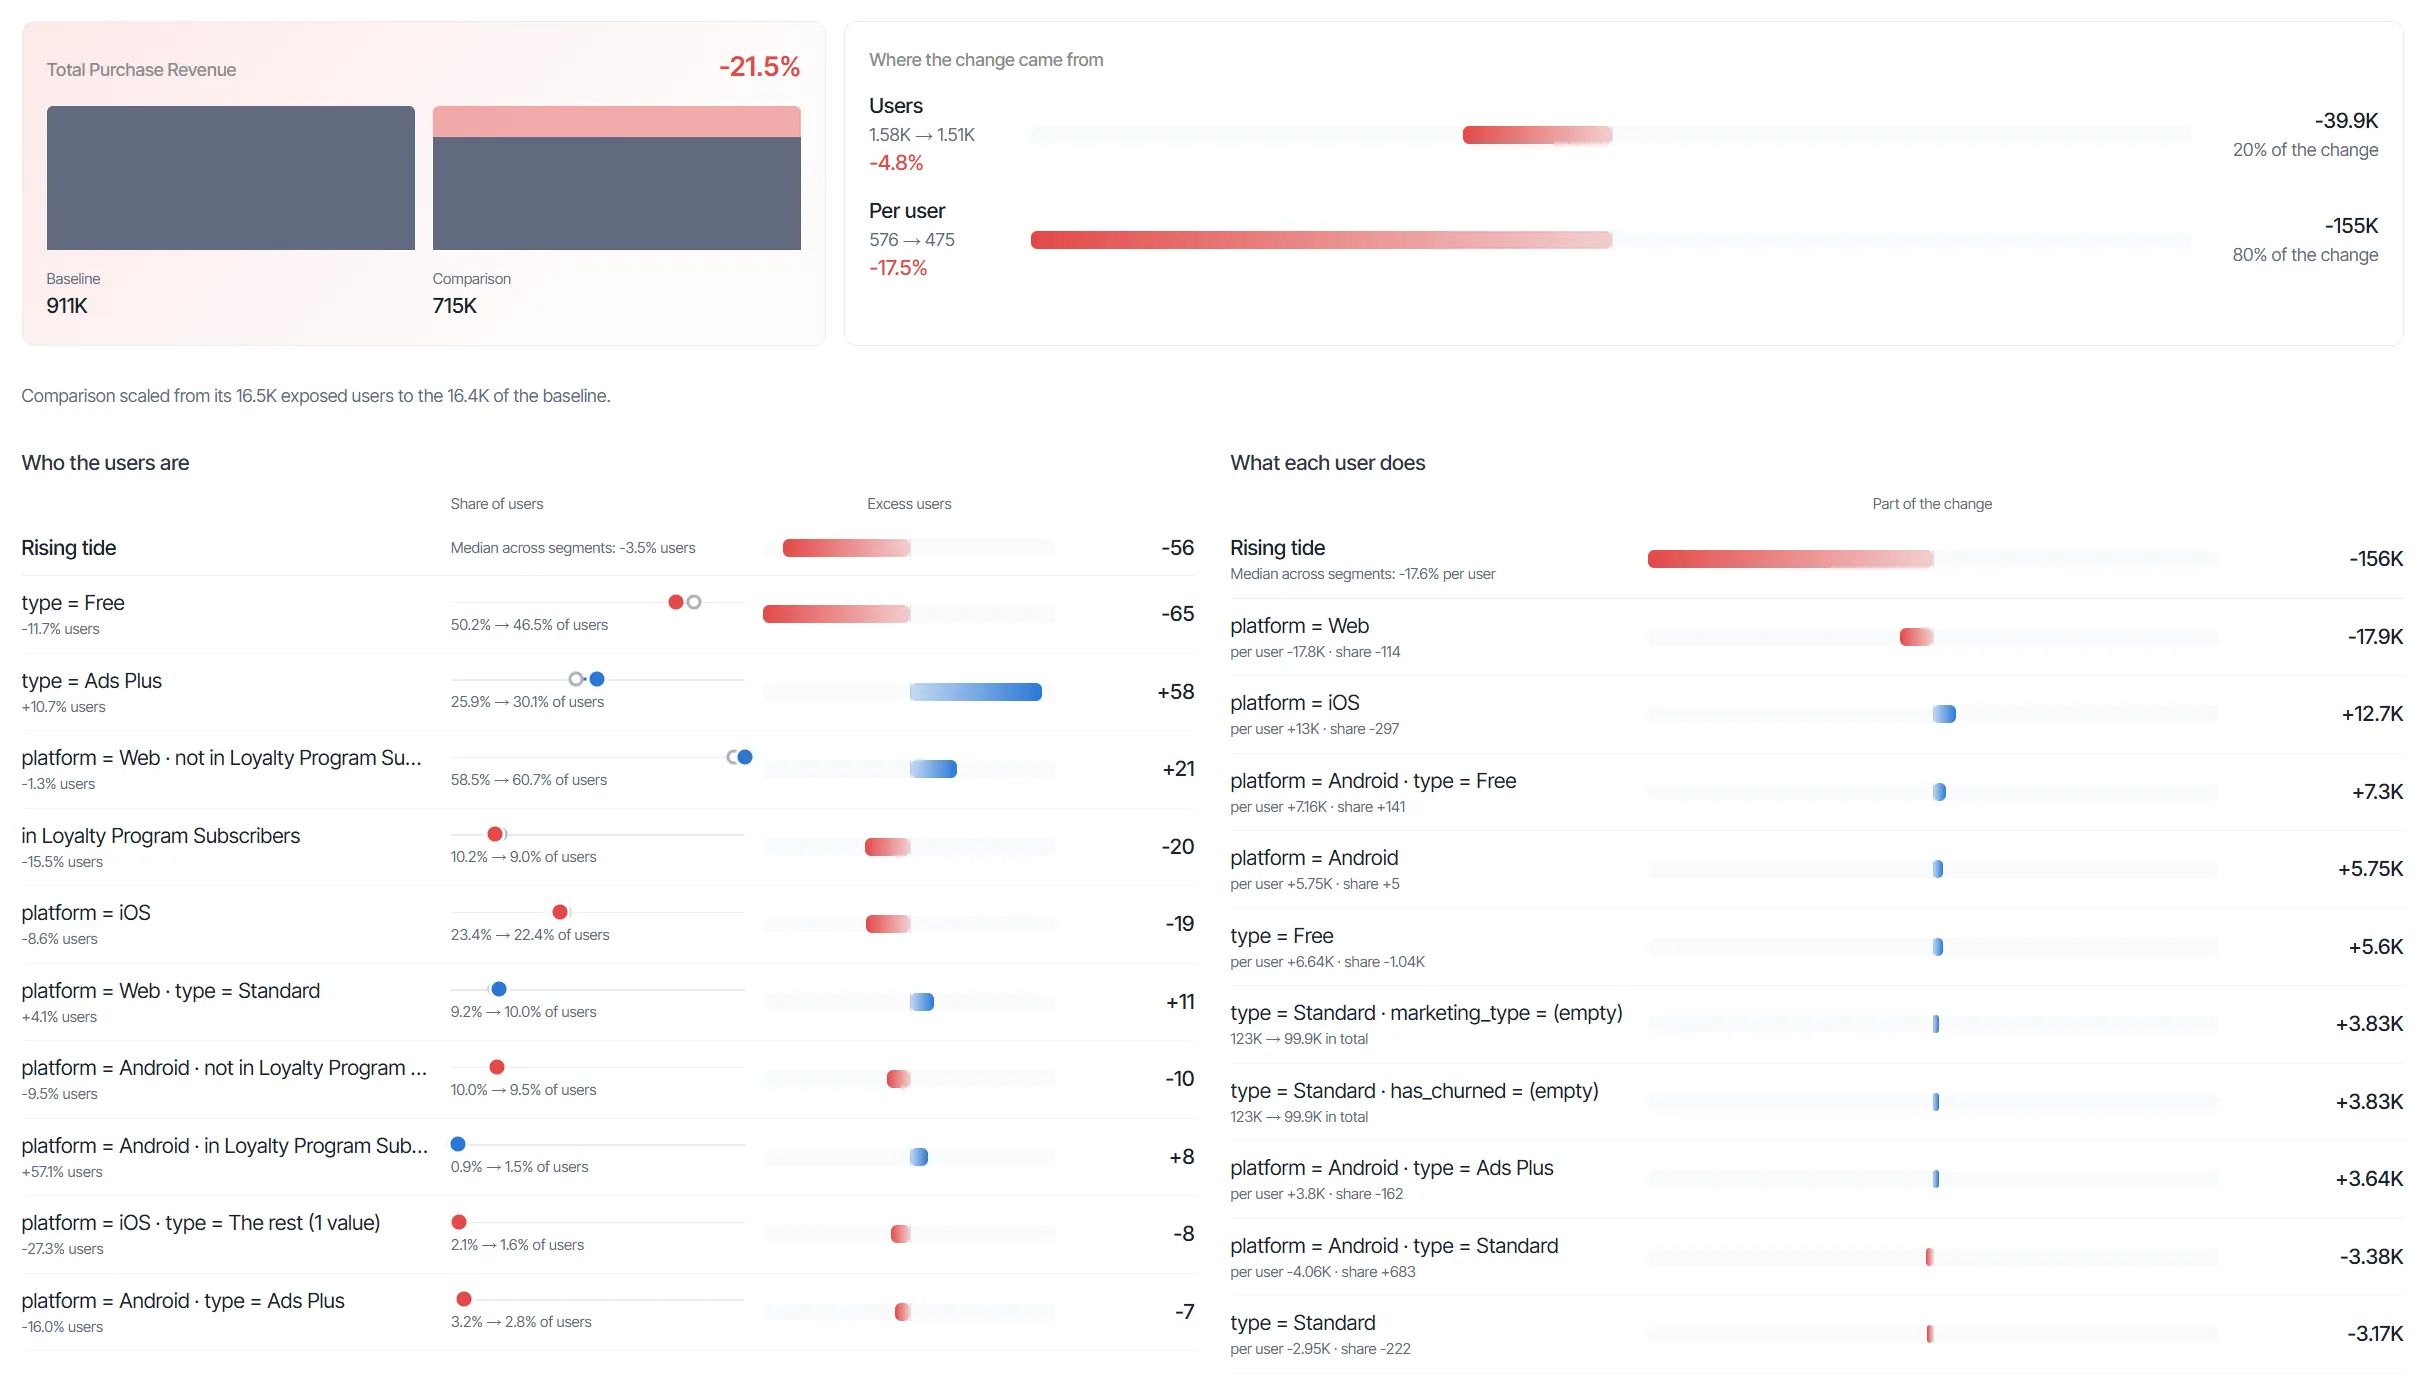
Read the headline
The headline has two cards that show the size of the change and how it splits.
The metric card shows the name of the metric, its percent change, and the totals for Baseline and Comparison.
The Where the change came from card splits the change into two rows:
- Users – The part of the change that comes from more or fewer users in the comparison population.
- Per user – The part of the change that comes from each user producing more or less of the metric.
Each row shows the baseline and comparison values, the percent change, and the signed contribution to the total change. Each row also shows its share of the change as a percentage. Blue bars show increases, and red bars show decreases.
When Users carries most of the change, investigate the Who the users are section. When Per user carries most of the change, investigate the What each user does section.
Understand the rising tide
The rising tide separates change that affected everyone from change specific to a segment. Analytics computes it as the median change across segments defined by a single attribute or segment, weighted by size. Each segment then shows only its change beyond the tide. The first row of each results section is Rising tide.
For example, suppose the rising tide is +10% users. A segment with 1,000 baseline users would have 1,100 comparison users with the tide. When the segment has 1,250 comparison users, it shows 150 excess users.
Who the users are
The Who the users are section shows which segments gained or lost users beyond the rising tide.
Each row shows the segment label and the percent change in its users. Each row also includes the following columns:
- Share of users – The share of the population that the segment holds in the baseline and in the comparison.
- Excess users – The users the segment gained or lost beyond the rising tide.
The segments defined by one attribute or segment add up, with the tide, to the whole change in users. Hover a row to see how Analytics calculates its excess users.
What each user does
The What each user does section shows which segments changed the metric per user beyond the rising tide. The Part of the change column shows how much each segment adds. The segments defined by one attribute or segment add up, with the tide, to the whole per-user change.
For user attributes and segments, the part of the change splits into two parts:
- From per user – The users of the segment doing more or less of the metric per user.
- From share of users – The share of users in the segment shifting between the baseline and the comparison.
Hover a row to see how Analytics calculates its part of the change.
Read segment labels
Segment labels name the values that define each segment, in one of the following patterns:
- Attribute value – An attribute and its value, such as country = US. Segments that combine two or three attributes or segments join their values with a middle dot (·).
- Cohort membership – in or not in, followed by the cohort name.
- The rest – Every value of the attribute that the analysis does not list, with the number of those values.
- (empty) – Empty values of the attribute, when the attribute lists the null value. Otherwise, empty values fall into The rest.
Numbers display with three significant digits in compact form, such as 591M. Excess users display as whole users.
Segment display rules
Root Cause shows a segment only when it meets the following rules:
- A segment needs at least 30 users across the two populations. It also needs at least 1% of the combined users of the two populations.
- A segment that combines several attributes or segments must explain at least half its effect beyond each parent segment.
- Each results section lists up to 10 segments, ranked by how much of the change they explain.
- Root Cause skips segments that only restate another segment, such as the false half of a true-or-false attribute.
Experiment variation results
Root Cause scales the comparison to the number of exposed users in the baseline. As a result, an uneven traffic split does not read as a difference in the metric. The results include a note with the number of exposed users on each side.
Unsampled queries and cached results
Root Cause runs every query without sampling, so small segments show their exact change. The sampling mode of the exploration does not apply. For information on sampling in other explorations, see Sampling.
Analytics keeps Root Cause results for 24 hours, instead of using the cache duration in application settings. Refresh the exploration to run the query against current data.
Troubleshoot Root Cause results
The results area shows a message when it has no breakdown to display. Some messages refer to attributes and segments as dimensions. The following messages identify what to do next:
- Pick a metric, what to compare and the dimensions, then run the analysis. – The analysis has not run yet. Complete the Metric, Compare, and Explain by sections, then run the analysis.
- The dimensions changed since the last run. Run the analysis again to see the breakdown. – The attributes or segments in Explain by no longer match the results. Run the analysis again.
- No segment stood out. – No segment met the display rules for the section. Choose other attributes, segments, or values, then run the analysis again.
- The query failed. Check the configuration and run it again. – The query did not complete. Review the configuration, then run the analysis again.