Dashboard overview
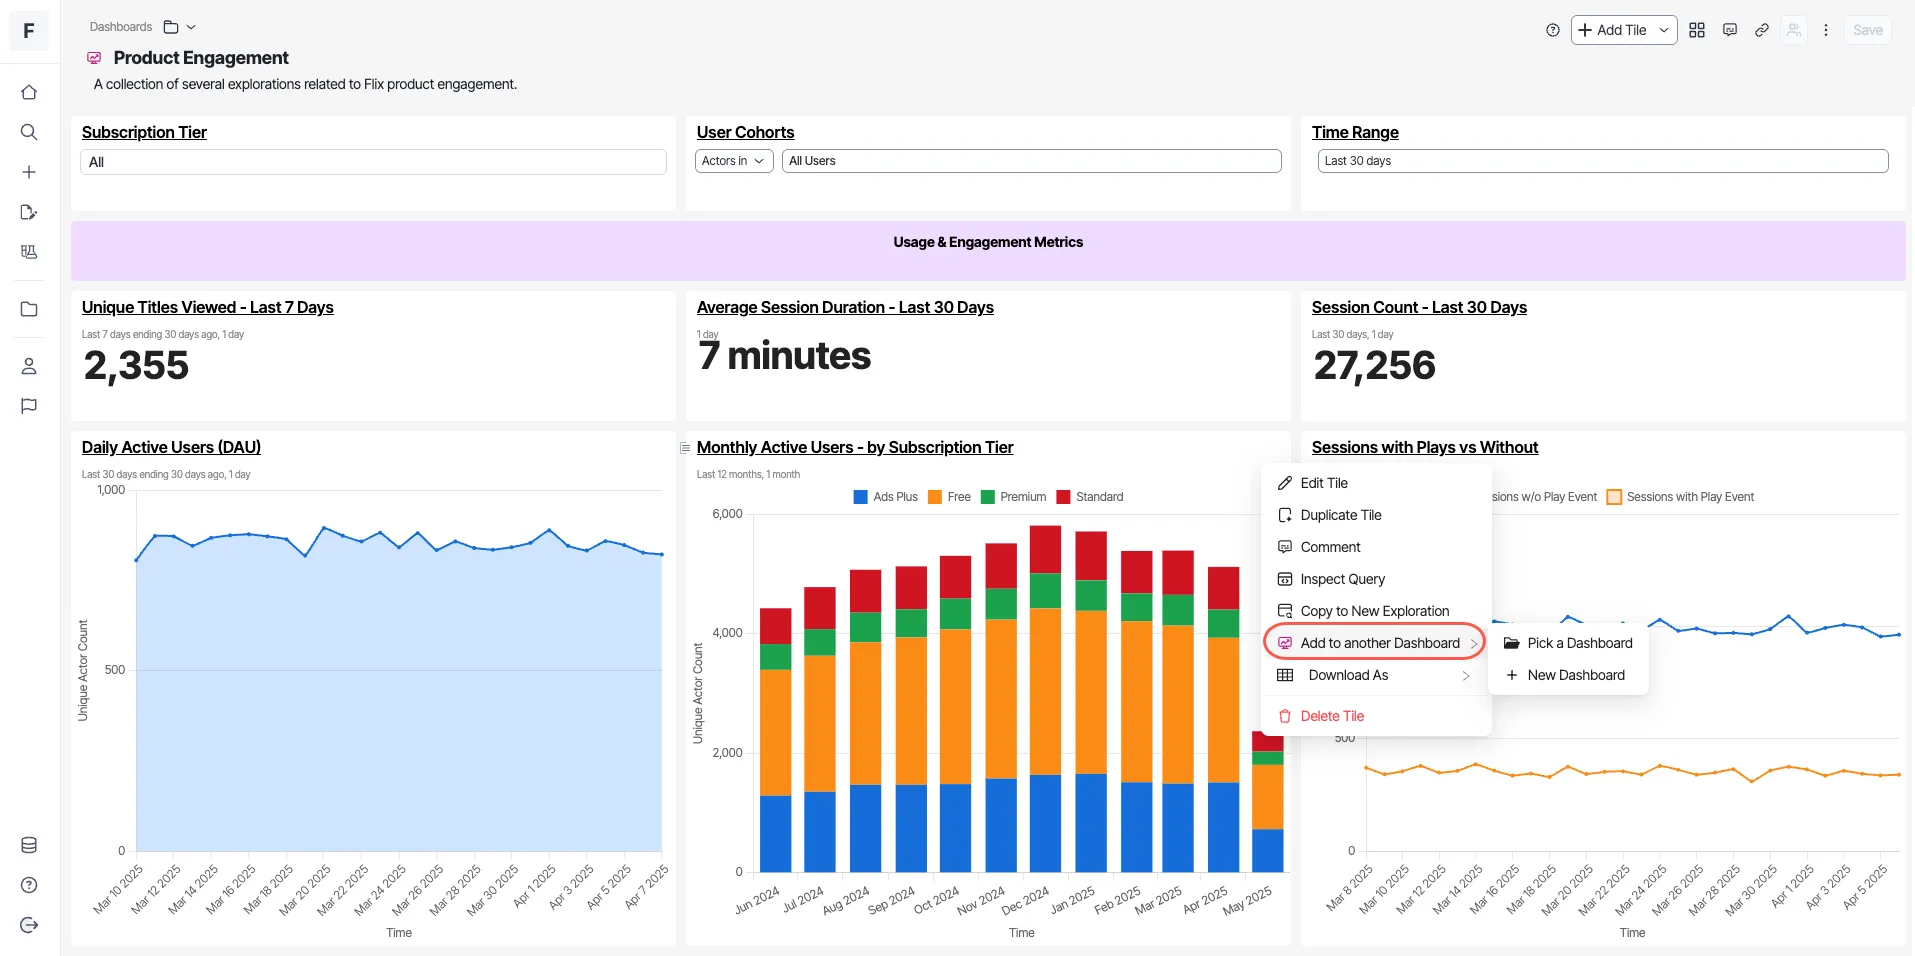
A dashboard in Optimizely Analytics is a collection of visualizations organized in a grid view, typically used to monitor operational metrics. Analytics dashboards offer various visualizations, parameterization, and layout options. They are interactive, letting you select a point in the dashboard visualization to conduct further analysis.
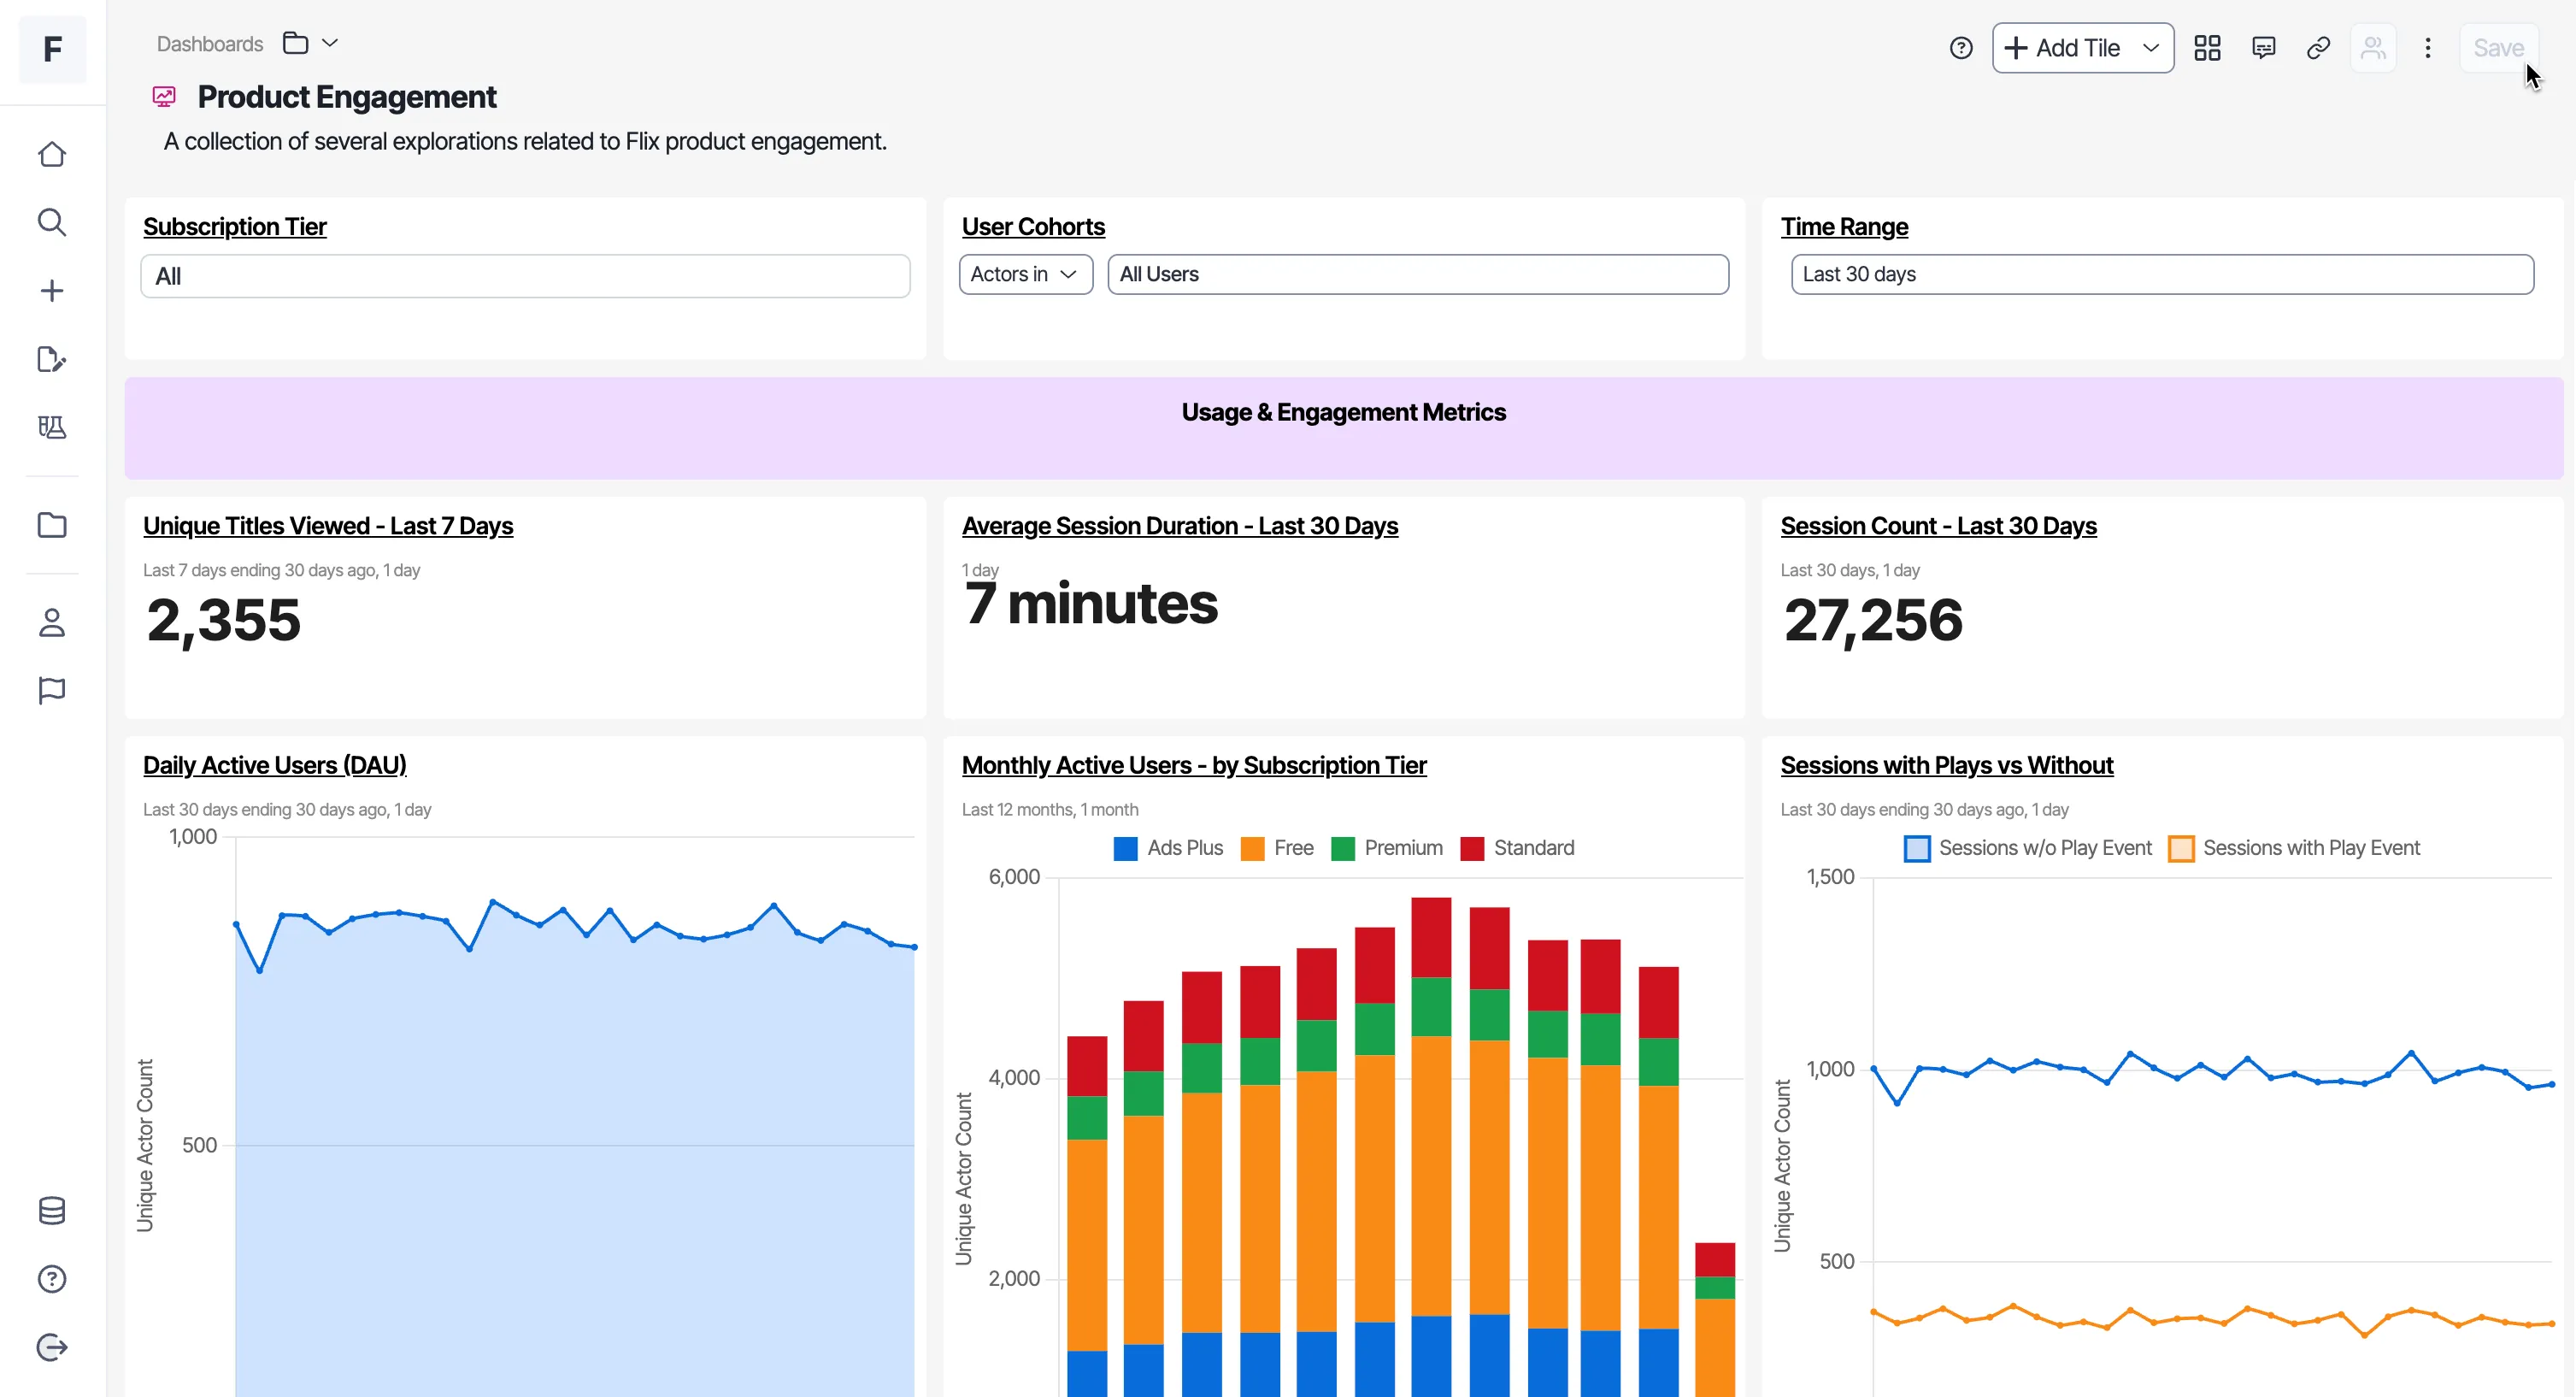
You can do the following with dashboards:
- Organize your explorations in one location.
- Get a 360-degree view of your critical data.
- Run side-by-side data comparisons.
- Conduct ad hoc analysis.
- Present your data effectively.
Create a dashboard
- Click + > New Dashboard.
- Enter a name and description.
- Use the key elements to build the dashboard.
- Click Save.
Key elements
The menu bar has different options for creating a dashboard, and they are as follows:

- Add tile – Add new tiles to the dashboard. See the list of supported tiles.
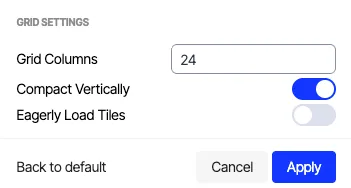
- Configure dashboard layout – Adjust grid settings and determine dashboard visualization layouts in rows and columns. Use the default settings unless you need to change them. The following are the options in this section:
- Grid Columns – Configure the layout and organization of dashboard elements by specifying the number of columns in the grid.
- Compact Vertically – Reduce vertical spacing between dashboard elements, creating a more condensed and streamlined layout.
- Eagerly Load Tiles – Load all dashboard tiles proactively, for immediate access to visualizations. By default, Optimizely Analytics only queries tiles as they scroll into view to conserve warehouse compute. This option changes that behavior, prioritizing loading speed for the entire dashboard.
- Share – Share your dashboard with others in your organization.
- Save – Save your dashboard.
- Comments – View and add comments related to your dashboard.
- Copy link – Copy the dashboard link.
- More (⋮) – Duplicate or delete the dashboard.
Edit dashboards
You can further edit dashboards in Optimizely Analytics with segmentation, creating beelines, and adding dashboard tiles to other dashboards.
Segment dashboard tiles
- Right-click the dashboard tile you want to segment.
- Choose Segment by Cohort or Segment by Attribute.
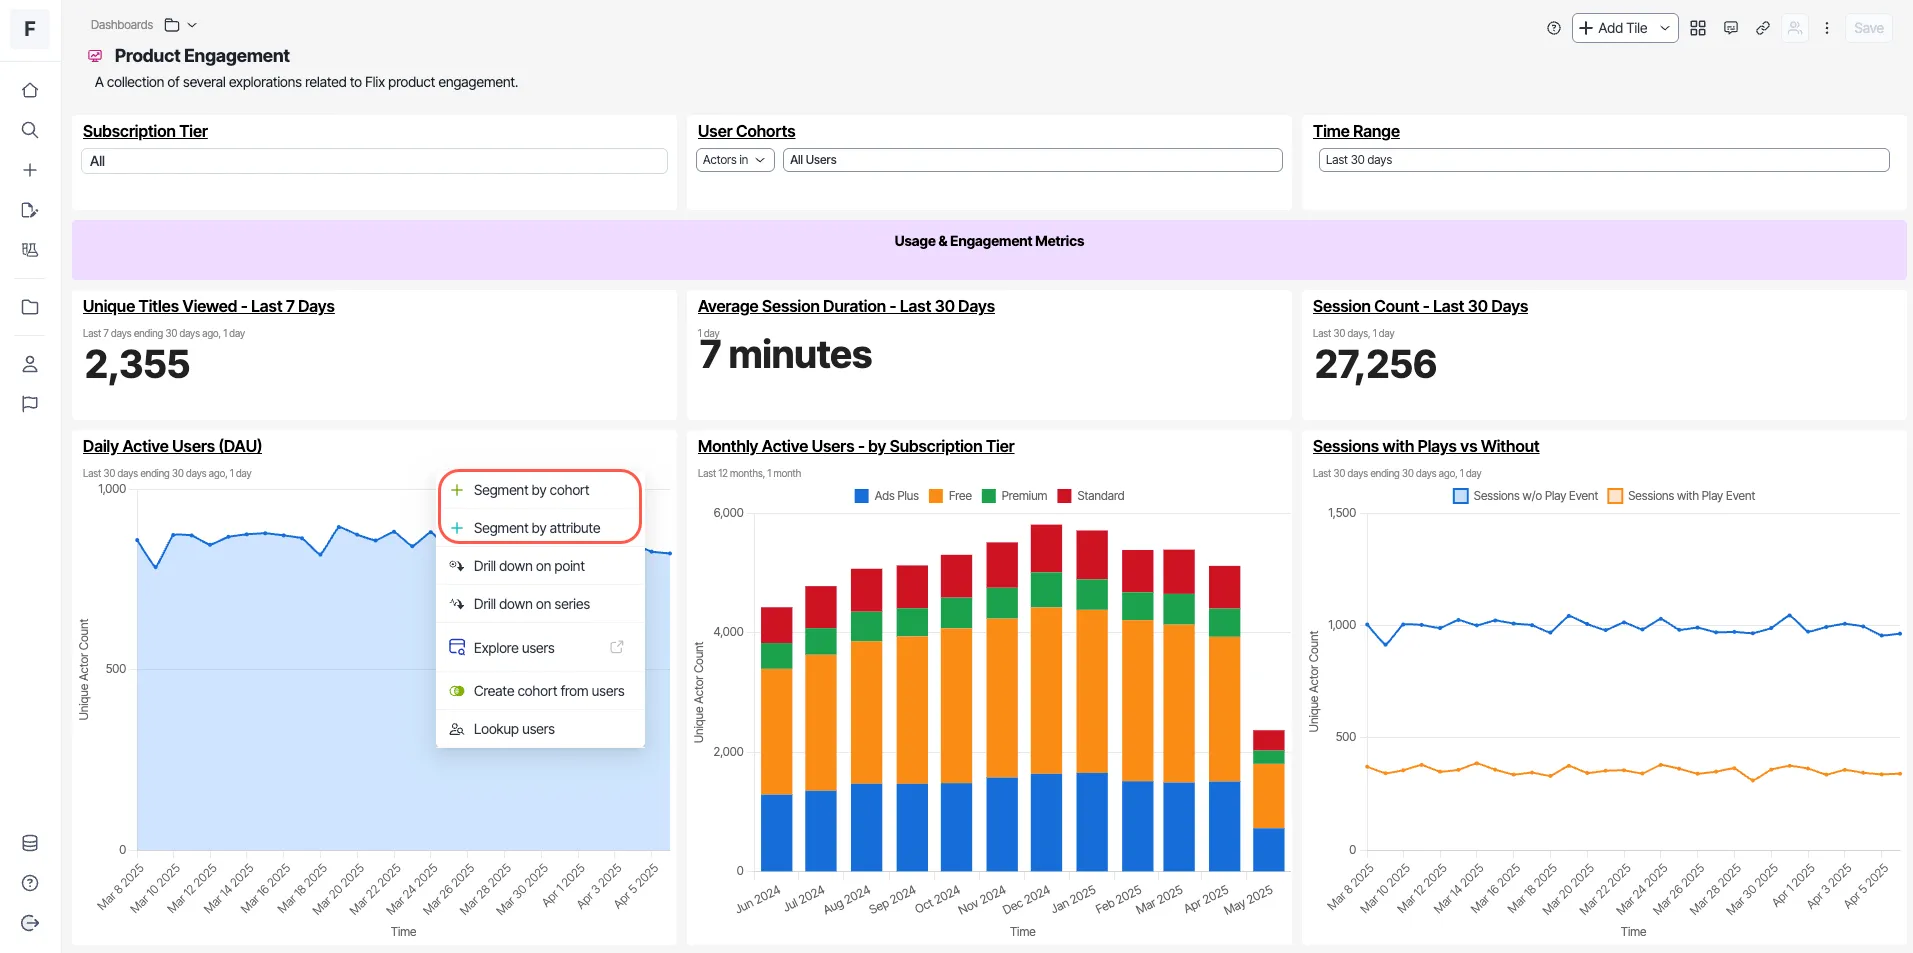
- Select an option from the drop-down list to adjust the chart on the tile.
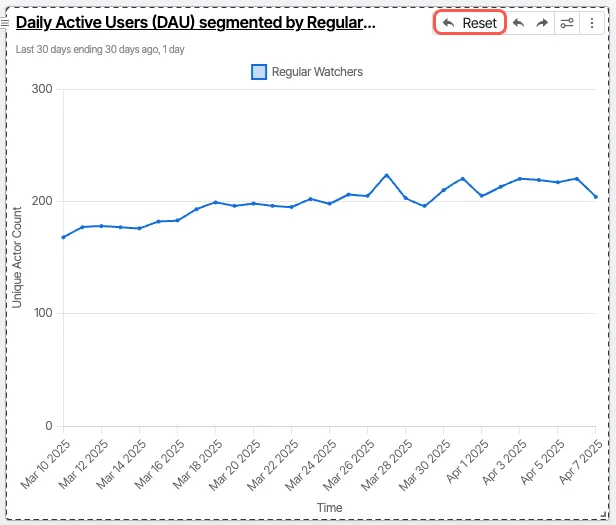
- Click Reset to revert the tile to its original state.
Create beelines within a dashboard
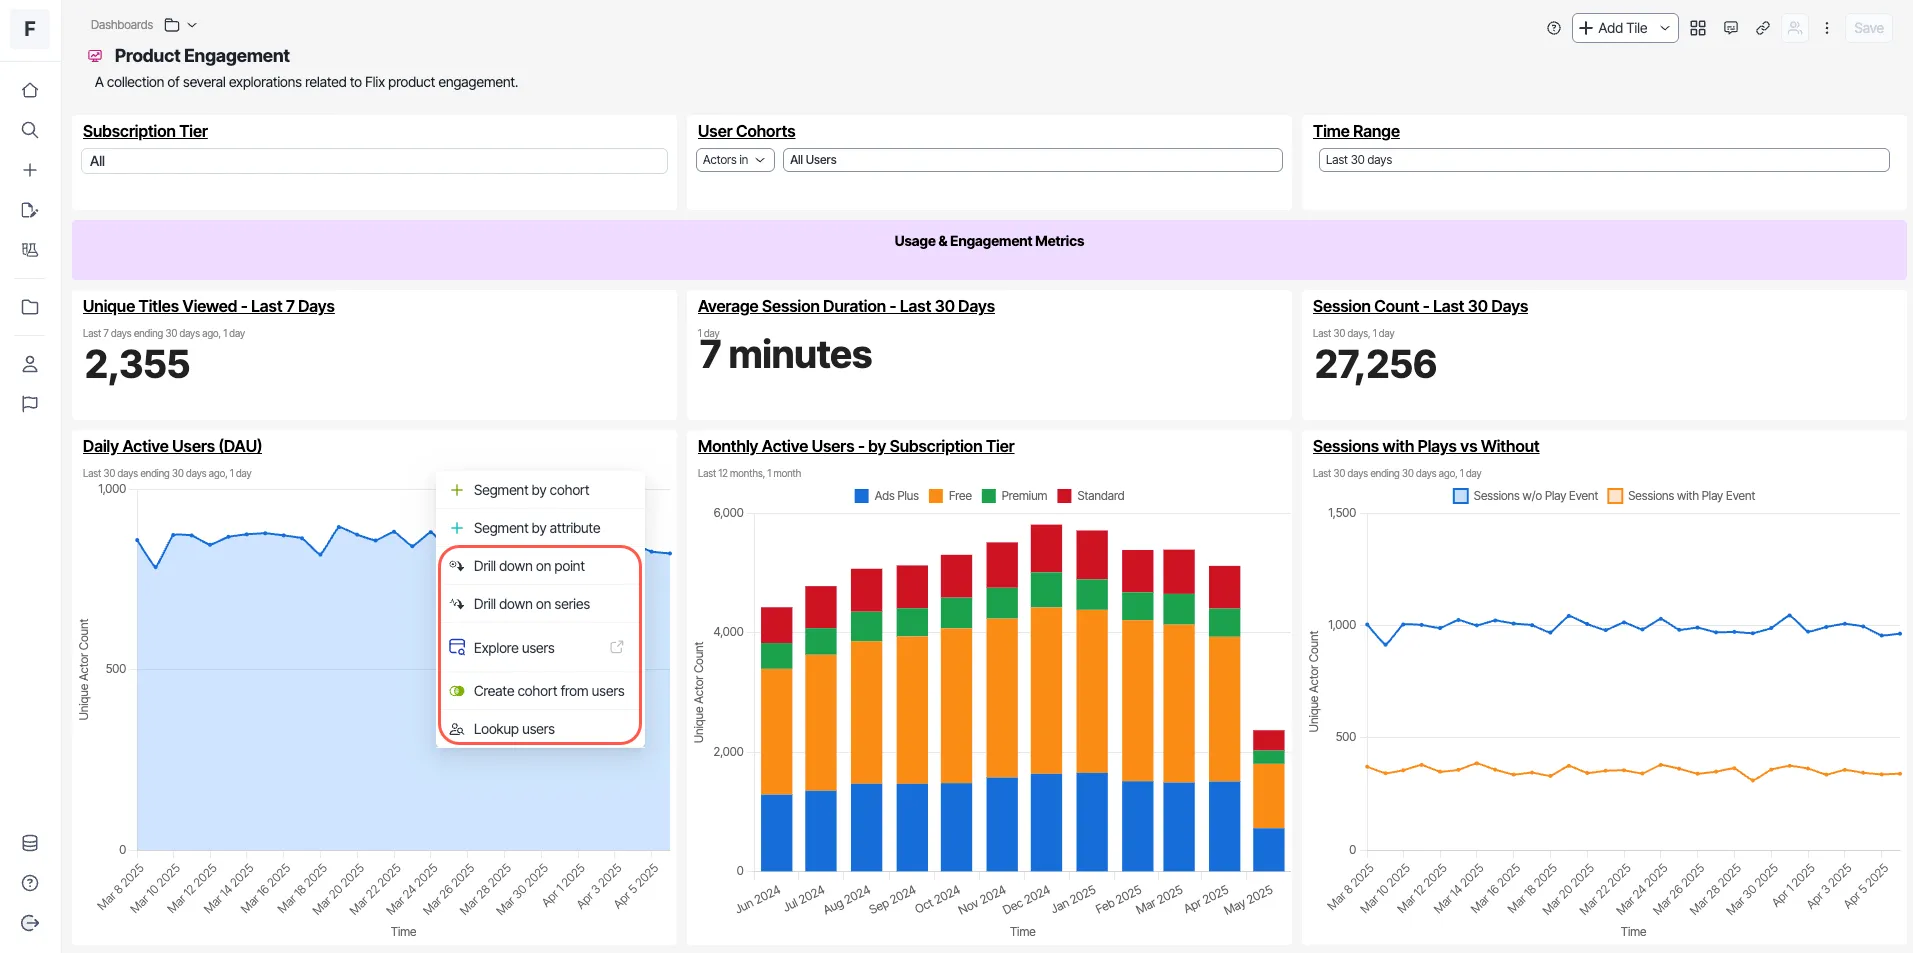
- Right-click the exploration from which you want to create a beeline.
- Choose a beeline from the following options:
- Drill down on point
- Drill down on series
- Explore users
- Create cohort from users
- Lookup users
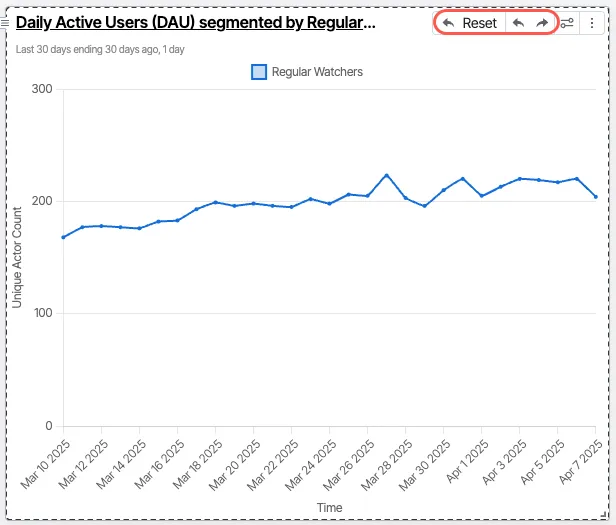
Use undo or redo to reverse actions, or click Reset to revert to the original state.
Configure click-through drilldowns
Click-through drilldowns give dashboard viewers the next analysis in one click. Choose one action for a tile, and a left-click on any data point runs that action. Viewers do not need to find the right-click menu or configure the drilldown themselves. Every viewer of the tile gets the same action, and the right-click menu keeps working.
For example, a bar chart shows signups by country. Set the action to Drill down on point and choose a device attribute. A left-click on a country's bar then breaks that country down by device.
Click-through drilldowns work on the following chart types:
- Line Chart
- Bar Chart
- Horizontal Bar Chart
- Bar Funnel Chart
- Pie Chart
- Bubble Chart
- Single Value, when the Display sparkline setting is on
Other chart types, such as Table, Sankey Chart, and Funnel Chart, do not support click-through drilldowns. On these chart types, the Drilldowns tab states that the chart type does not support drilldowns.
To configure a click-through drilldown, complete the following:
- Open the exploration and click More > Edit visualization.
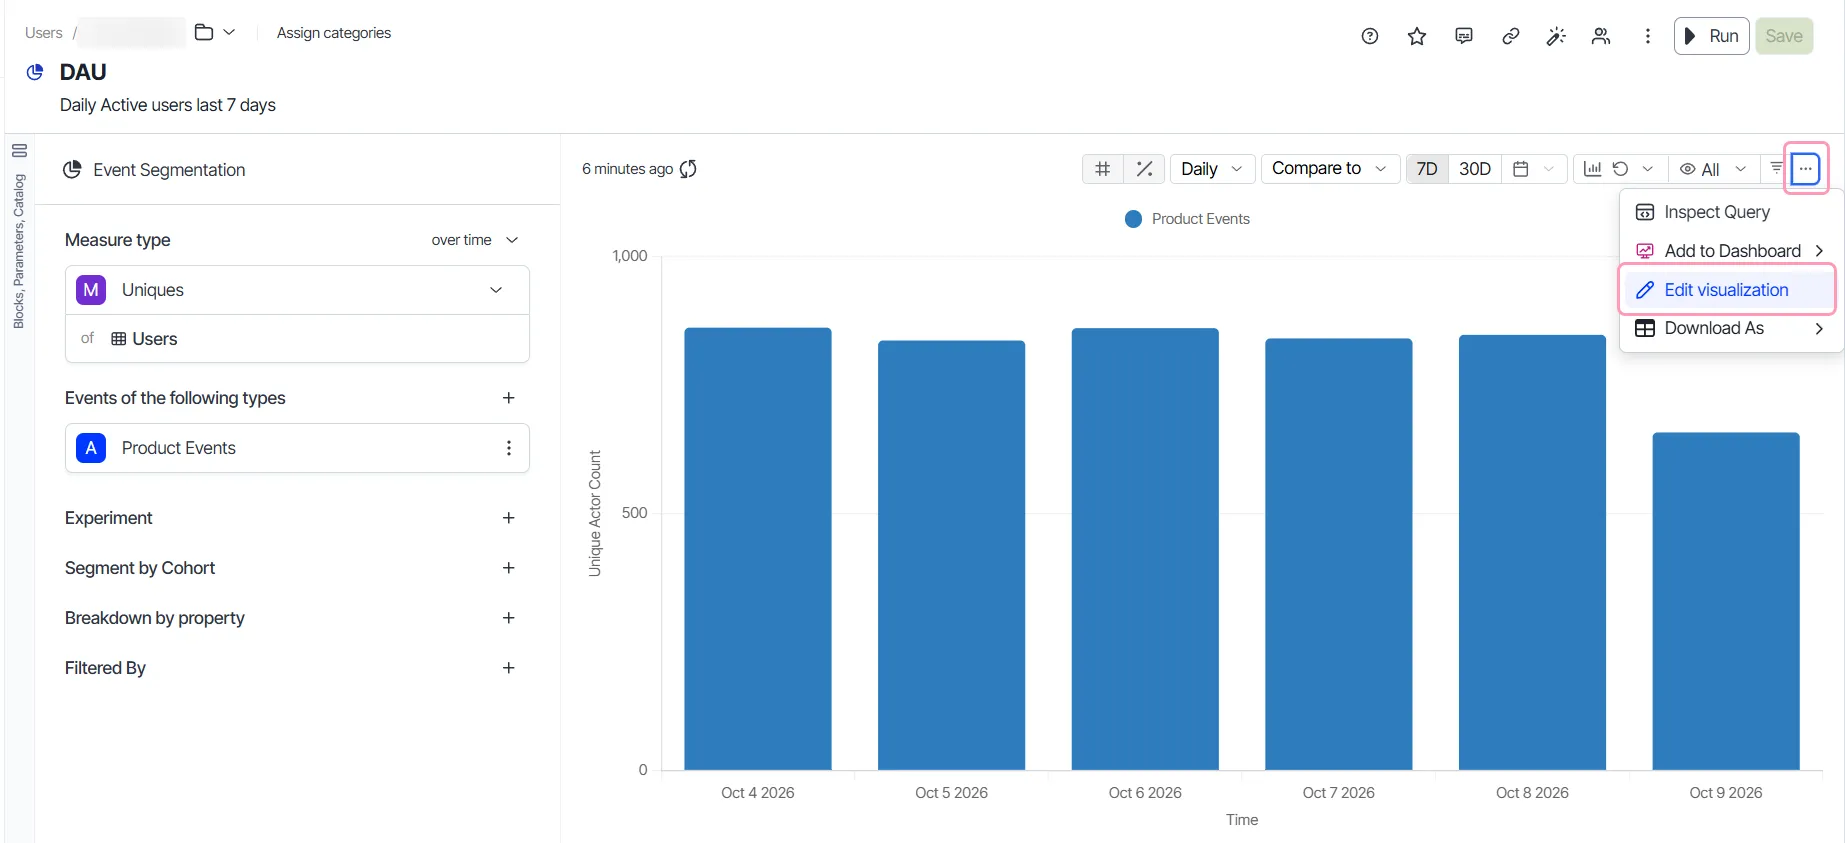
- Click the Drilldowns tab.
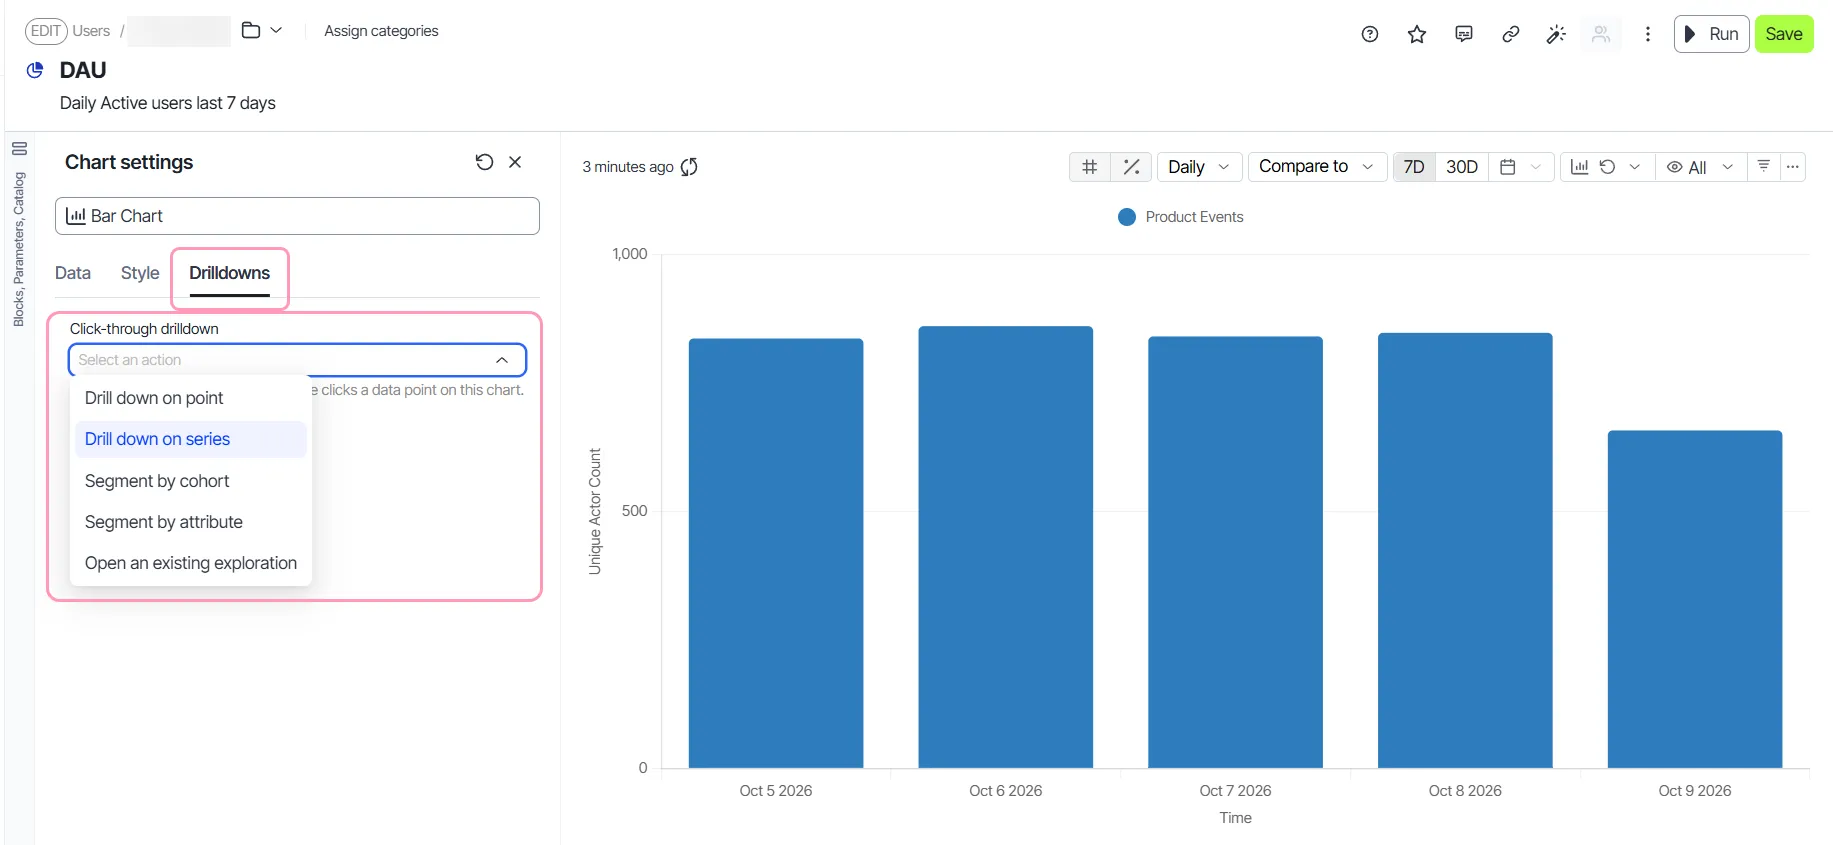
- Select an action from the Click-through drilldown drop-down list. See drilldown actions.
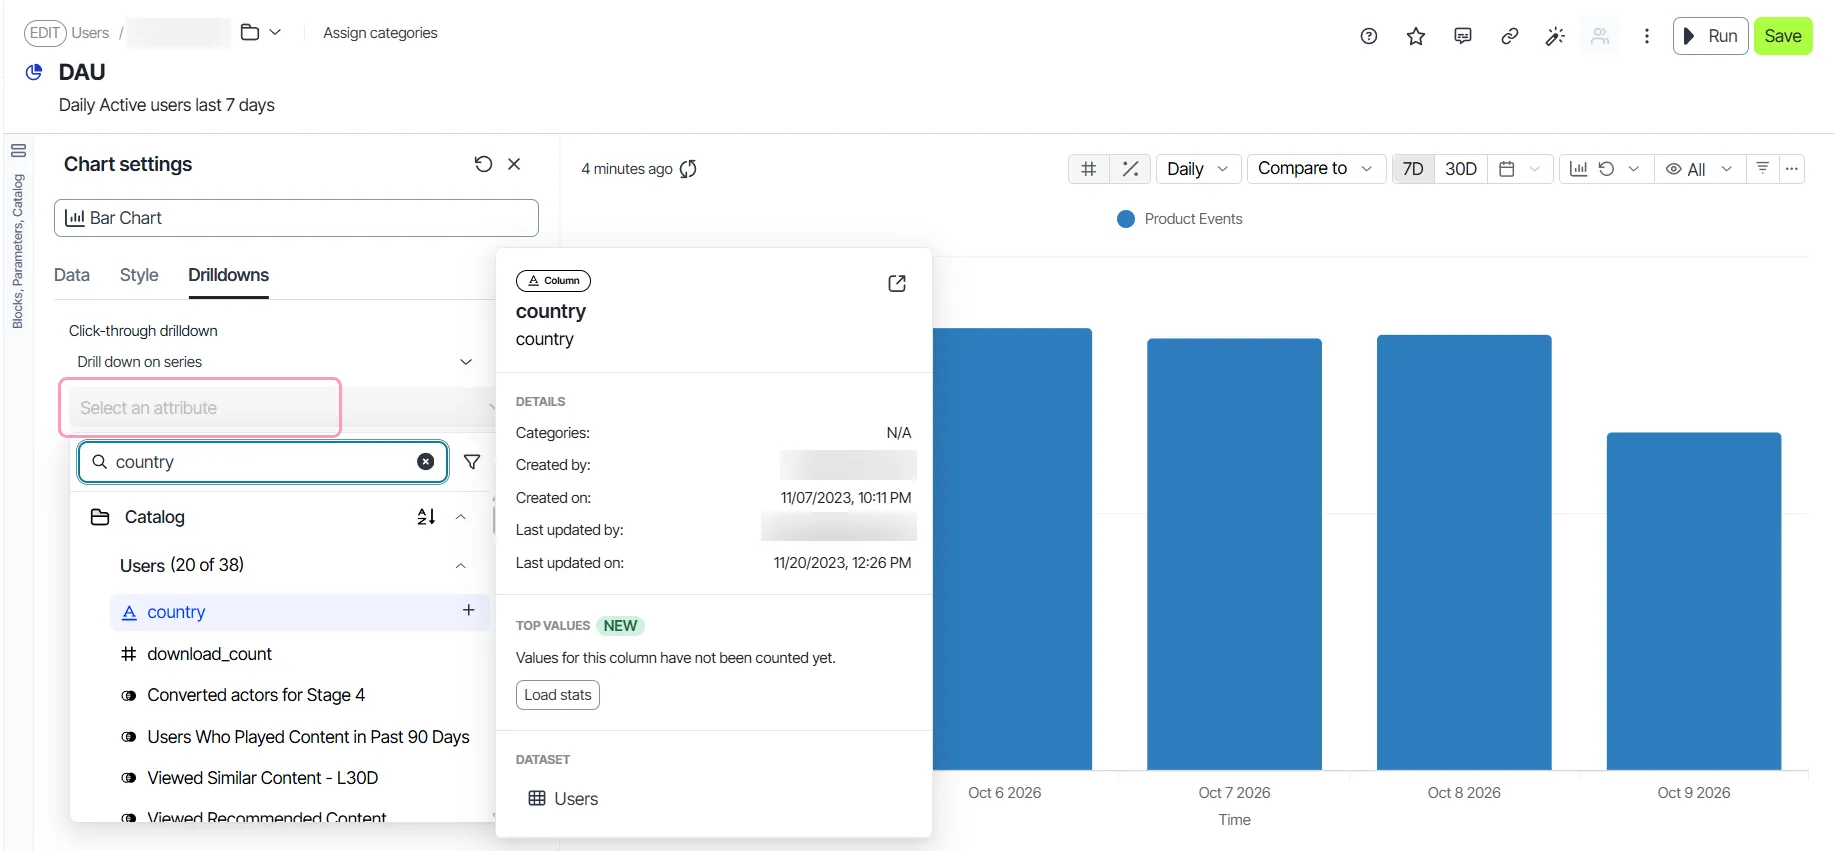
- Select the attribute, cohort, or exploration that the action uses.
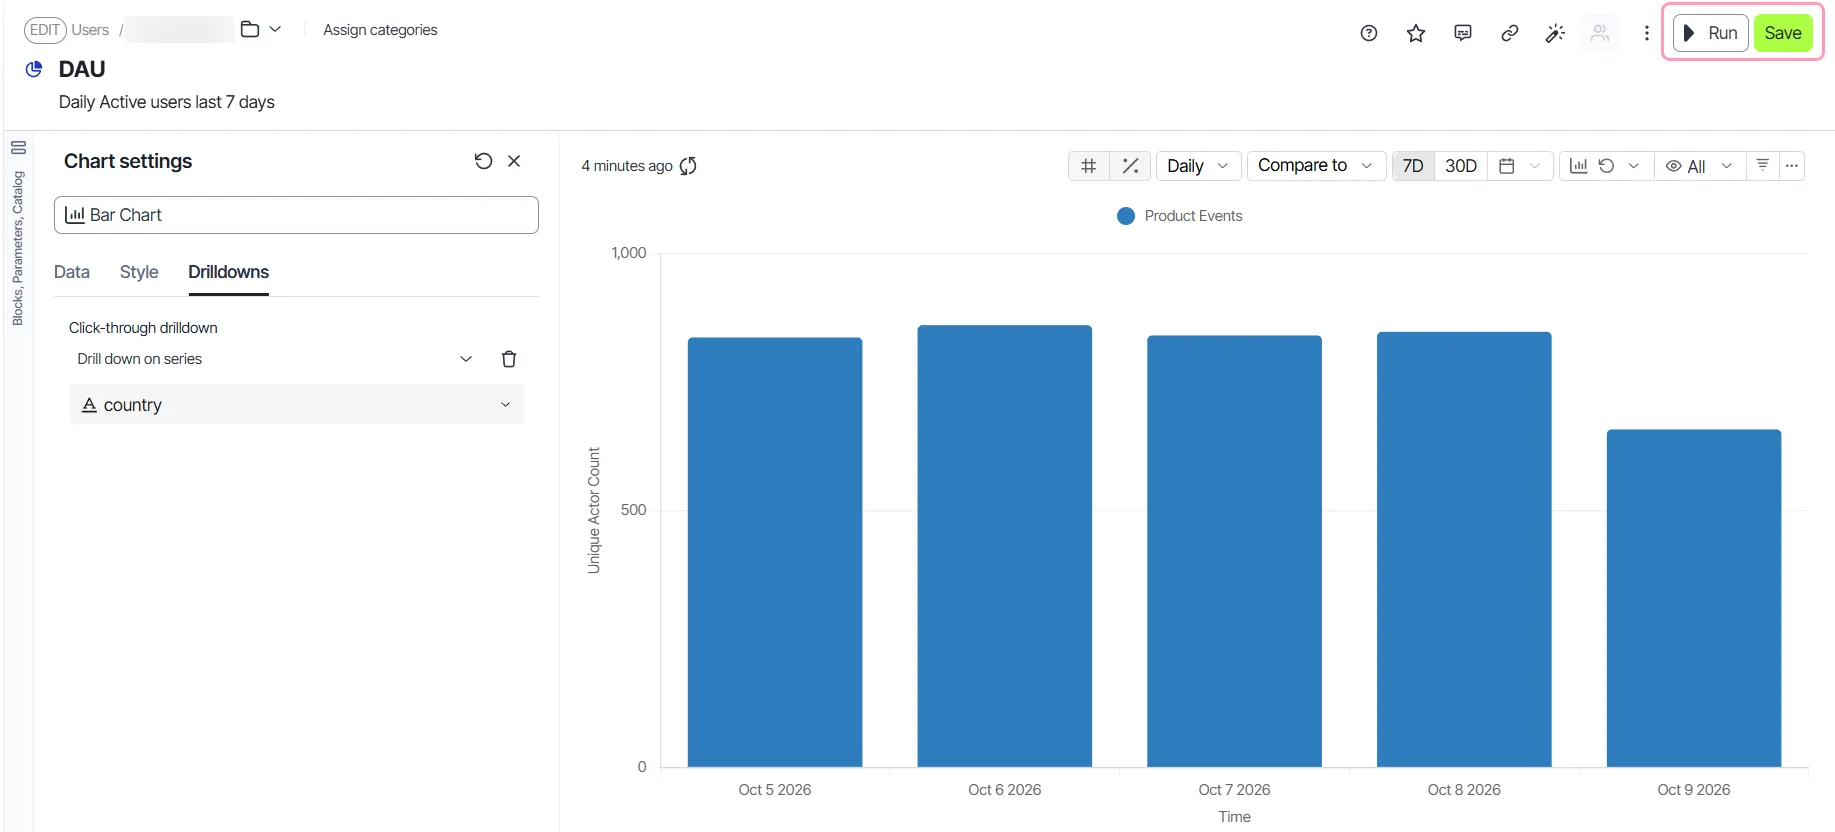
- Click Save.
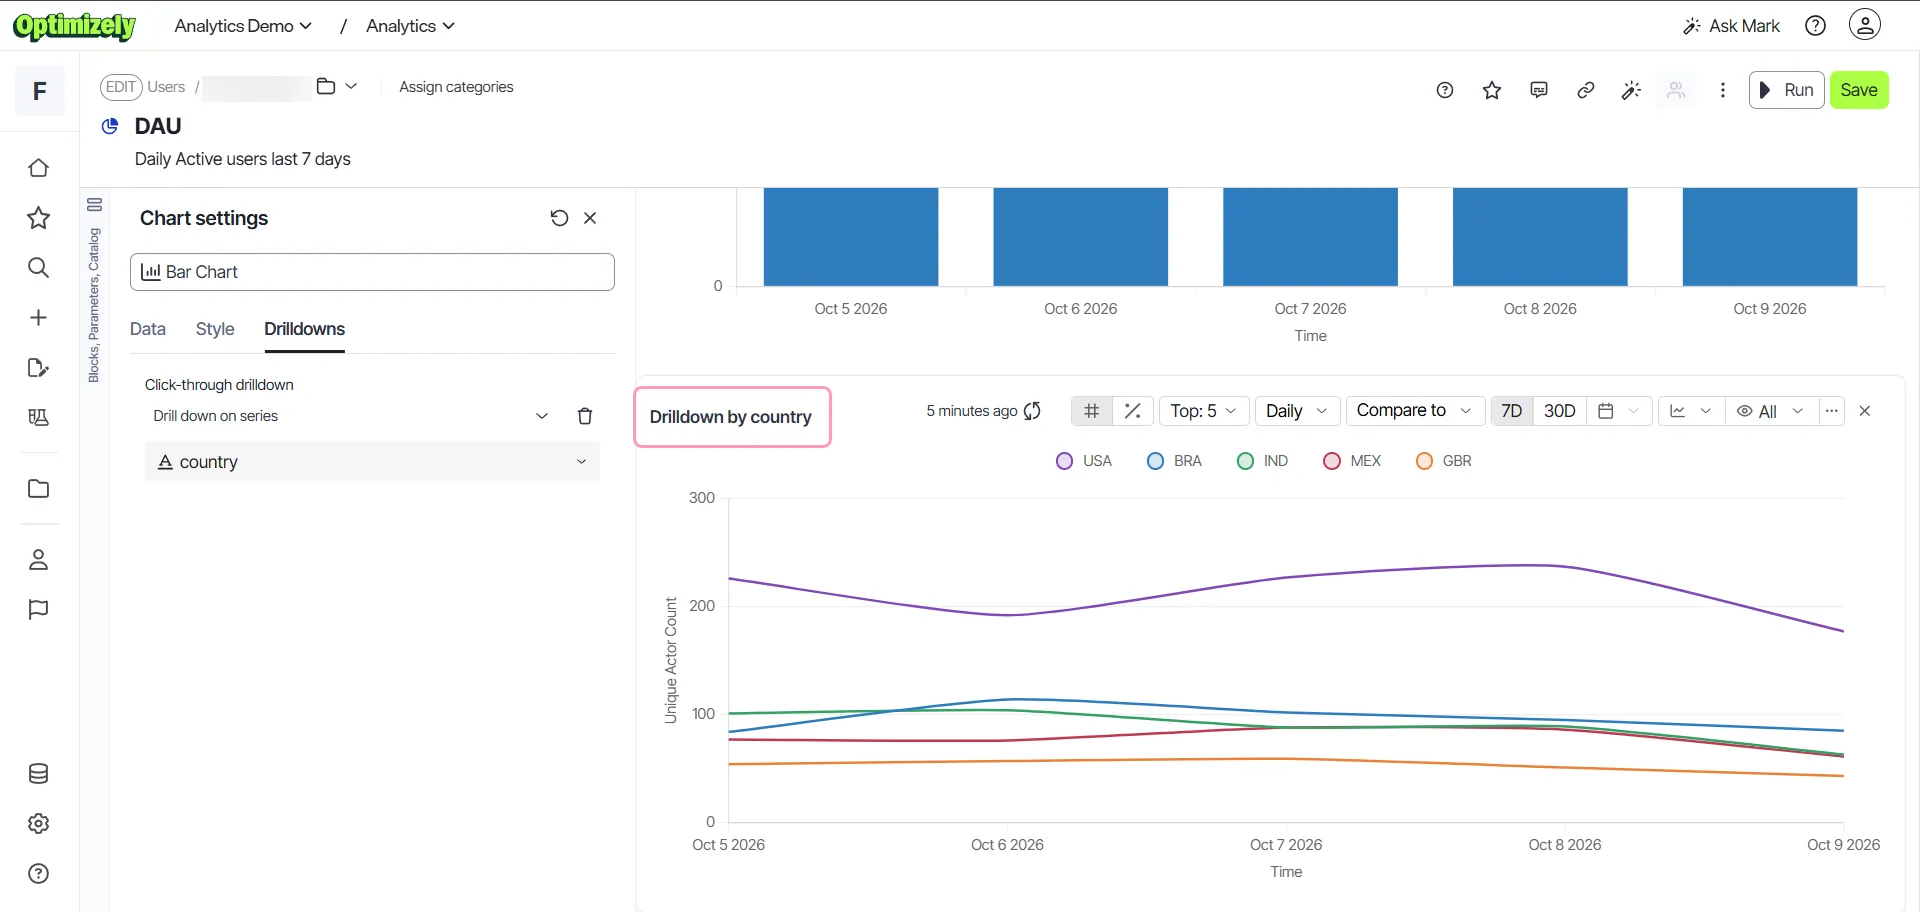
- Left-click a data point on the chart to view the drilldown.
The chart runs the action you selected. For example, the DAU exploration charts daily active users and uses Drill down on series with country. A left-click on any bar adds a Drilldown by country chart. The chart shows daily active users over time for each country.
Click-through drilldown actions
The Drilldowns tab offers the same drilldowns as the right-click menu. Most actions use an attribute, which is a property of a user or event, such as country or device.
- Drill down on point – Breaks the clicked data point down by the attribute you select.
- Drill down on series – Breaks the whole series down by the attribute you select, over time. This action works only on charts that show data over time.
- Segment by cohort – Splits the chart by membership in the cohort you select. A cohort is a saved group of users who share a behavior or property.
- Segment by attribute – Splits the chart by the values of the attribute you select.
- Open an existing exploration – Opens the saved exploration you select in place of the chart. The exploration opens as saved and does not filter to the clicked data point.
Actions that do not fit the exploration behind the tile show as unavailable. Each unavailable action includes the reason in the drop-down list.
Click-through drilldown behavior
Keep the following in mind when you configure click-through drilldowns:
- Each tile has one click-through drilldown. Selecting a different action replaces the previous one.
- To remove the drilldown from a tile, click Clear drilldown on the Drilldowns tab.
- If a tile switches to an unsupported chart type, Analytics keeps the drilldown but does not run it. Switch back to a supported chart type to use the drilldown again.
- When a viewer cannot load the linked exploration for Open an existing exploration, Analytics shows the Couldn't open the drilldown target error. Confirm that the exploration exists and that the viewer has permission to view it.
Add dashboard tiles to other dashboards
Within explorations
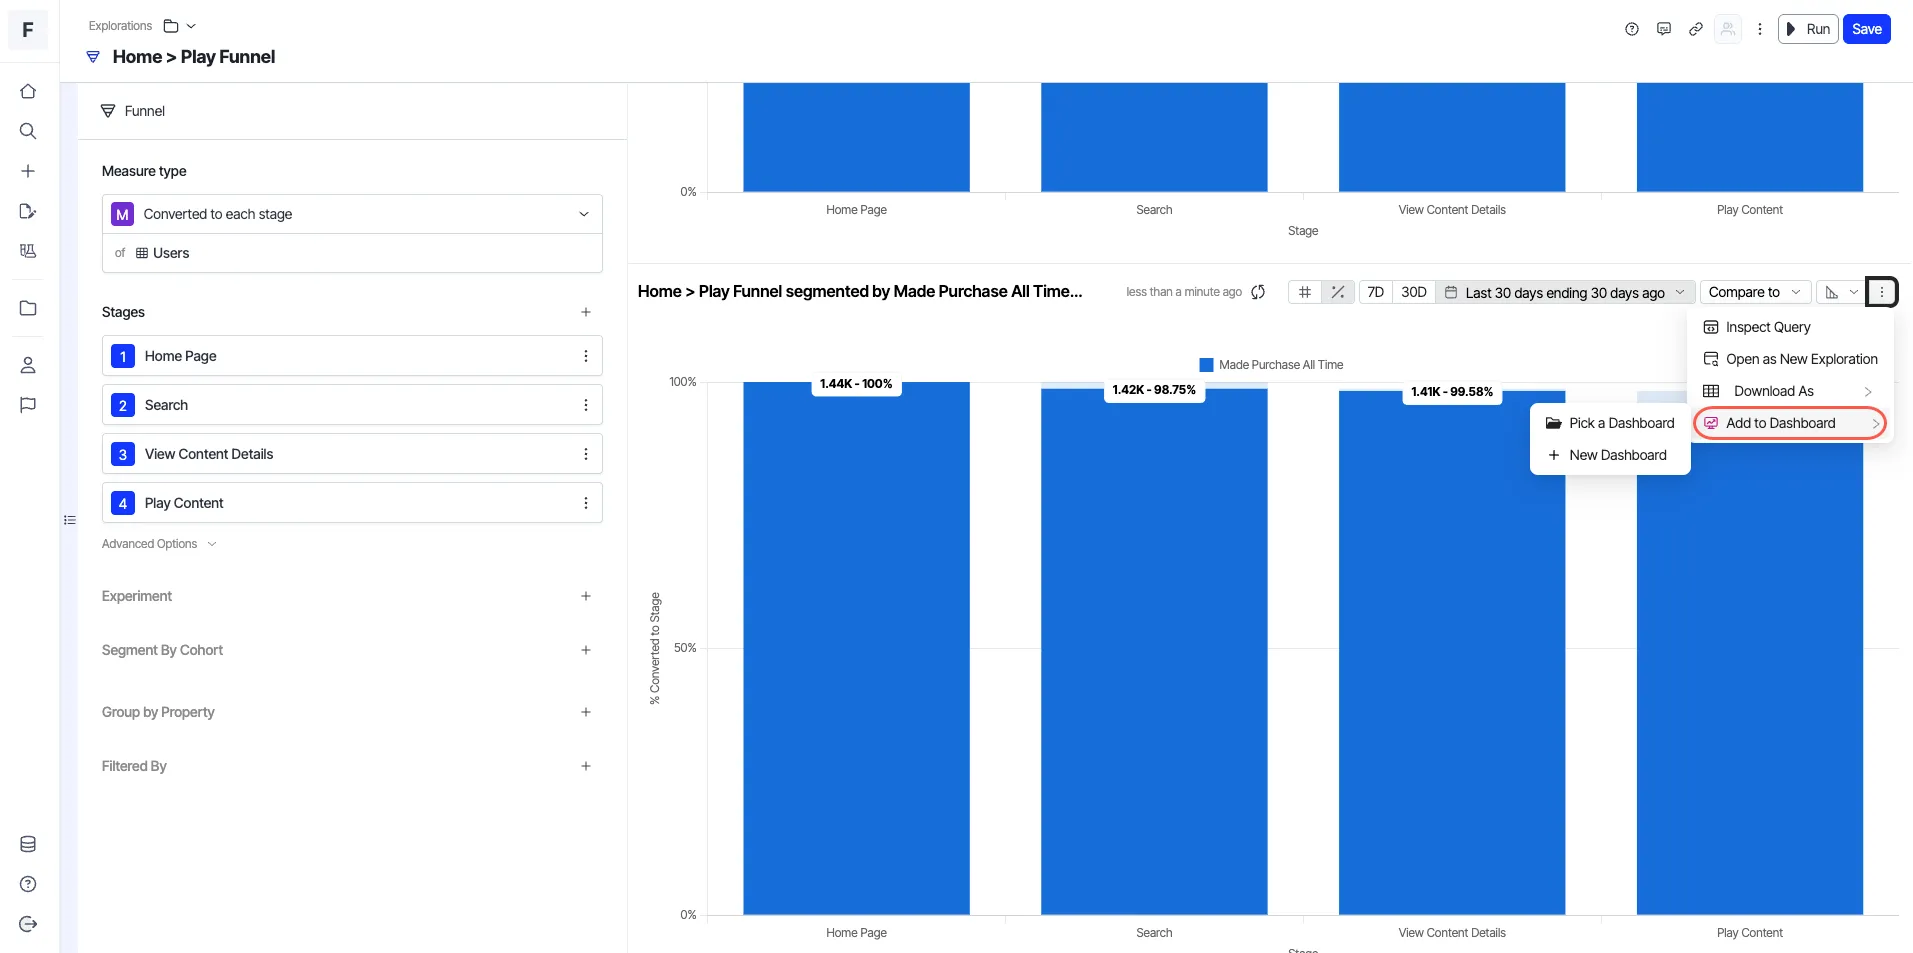
Create inline beelines directly within an exploration and add each one to a dashboard of your choice. Each beeline displays as a separate tile, helping you visualize and organize insights more effectively.
- Create a beeline within any exploration.
- Click More (⋮) > Add to Dashboard.
- Choose Pick a Dashboard to add the beeline to an existing dashboard or New Dashboard to create a dashboard with the beeline as a tile.
Within dashboards
Add existing tiles or new segmented explorations to multiple dashboards, reuse, and share insights.
- Click More (⋮) > Add to Dashboard.
- Choose Pick a Dashboard to add the tile to an existing dashboard or New Dashboard to create a dashboard with the tile.
- Click Apply.