Create an Experiment Scorecard in Optimizely Analytics
Products
- Optimizely Feature Experimentation
- Optimizely Web Experimentation
- Optimizely Performance Edge
The availability of features may depend on your plan type. Reach out to your Customer Success Manager if you have any questions.
Prerequisites
Complete the following to create an experiment scorecard in Warehouse-Native Experimentation Analytics:
- Add your Optimizely account ID in the Warehouse-Native Analytics app settings. To add your account ID, contact Optimizely Support.
- Have an experiment in Optimizely Feature Experimentation or Optimizely Web Experimentation.
Configure the Experiment Scorecard in Optimizely Analytics
Warehouse-Native Experimentation Analytics provides a structured way to compare experiment variations against any business metrics stored in your data warehouse. It simplifies tying experiments to business outcomes and provides deeper insights into user behavior and experiment performance.
- Click + > Experiment Scorecard.
- Select the preferred Experiment and Dataset on the definition page and set the Threshold.
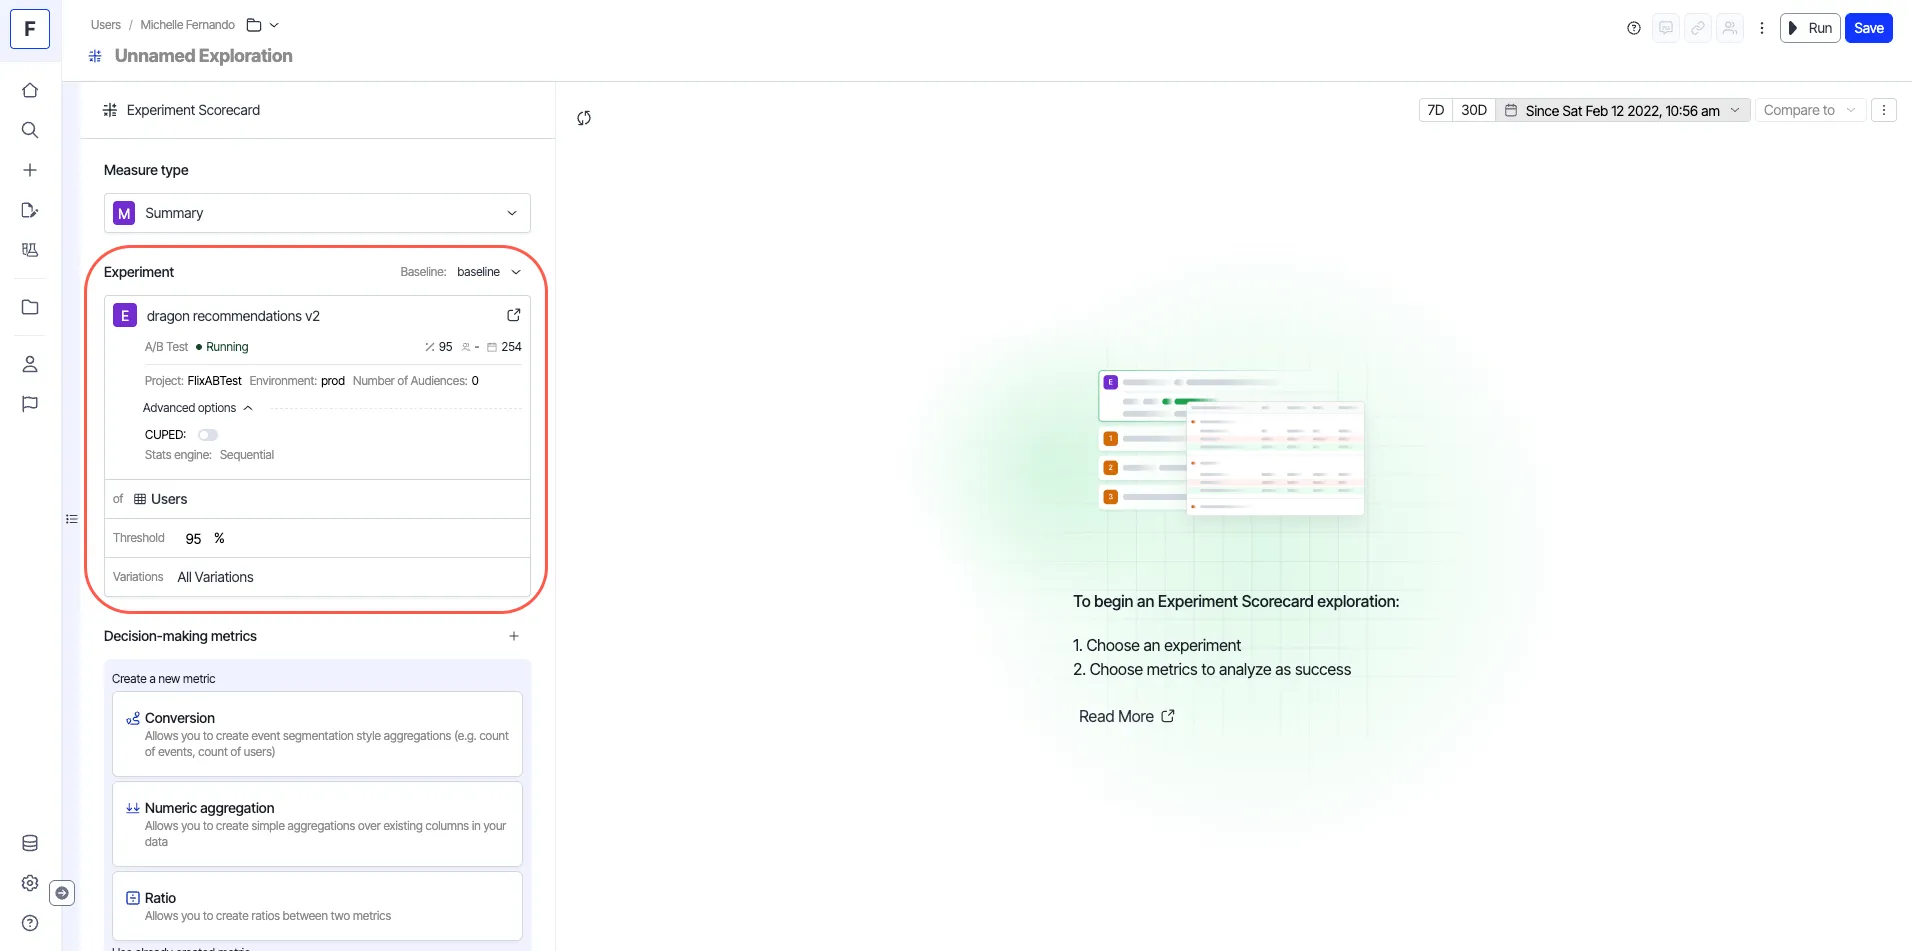
- Define Decision-making metrics. You can choose to use a previously created metric or create one. Learn more about creating Metrics.
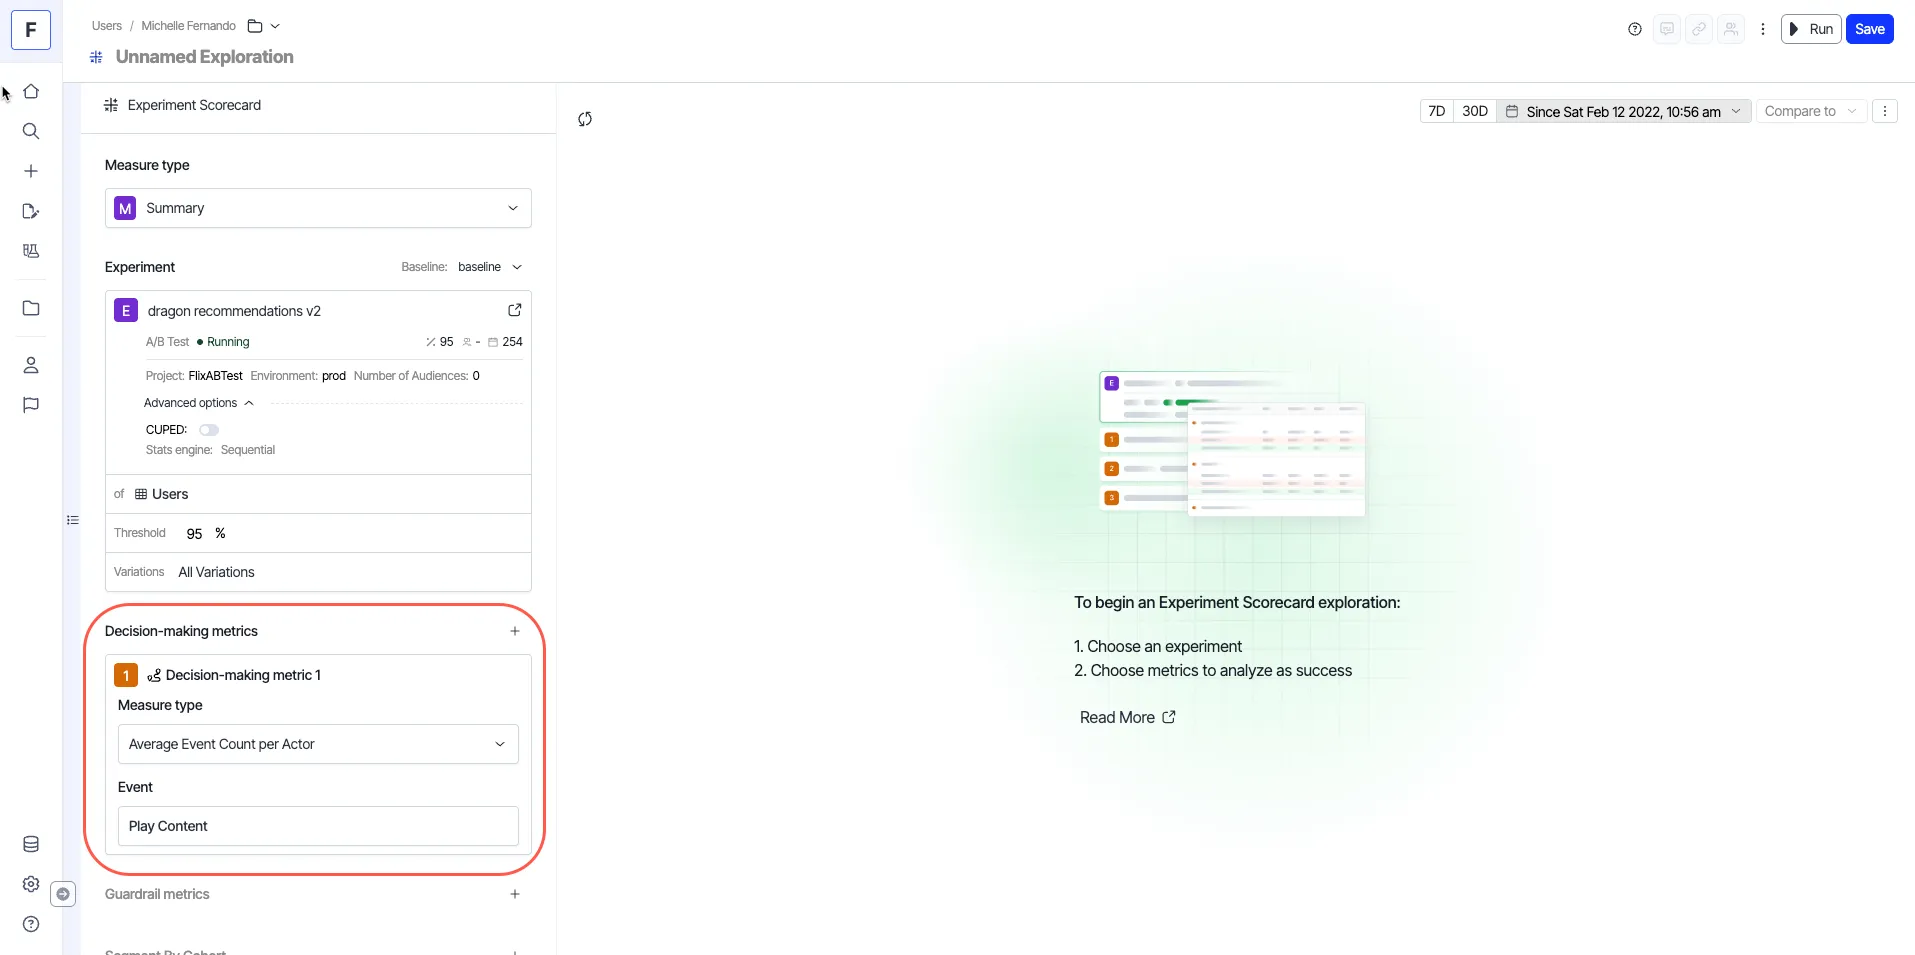
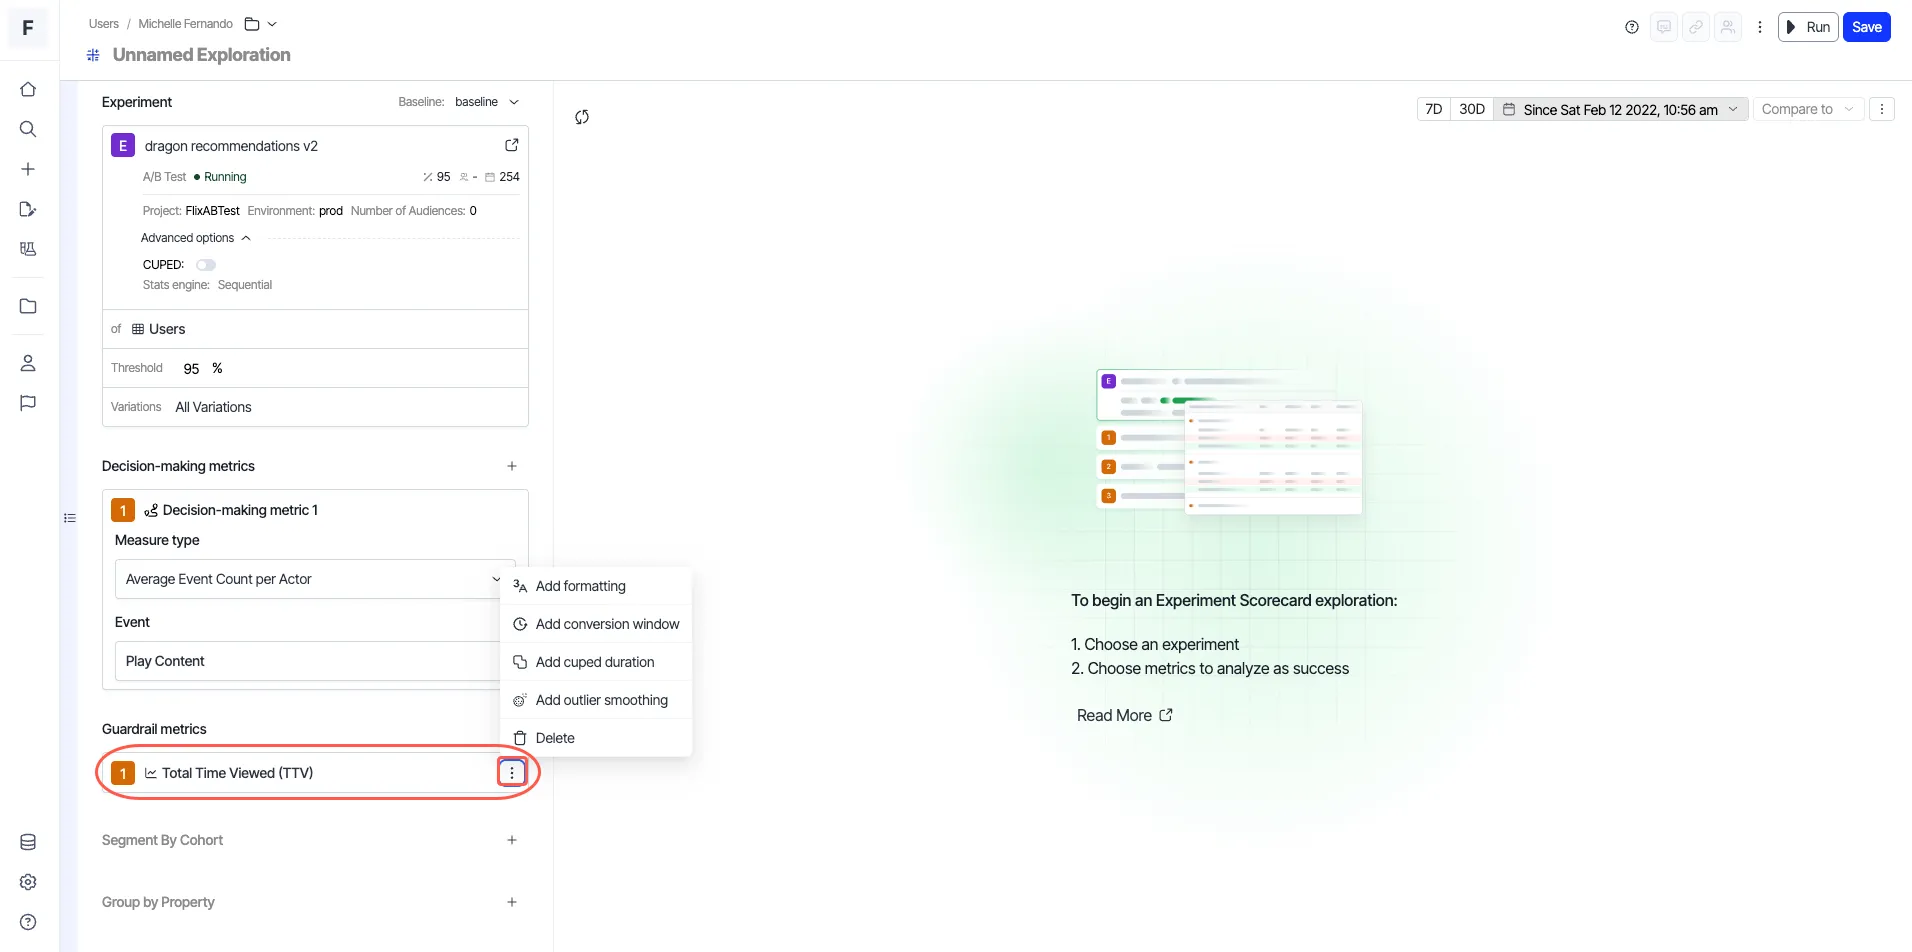
- (Optional) Add Guardrail metrics.
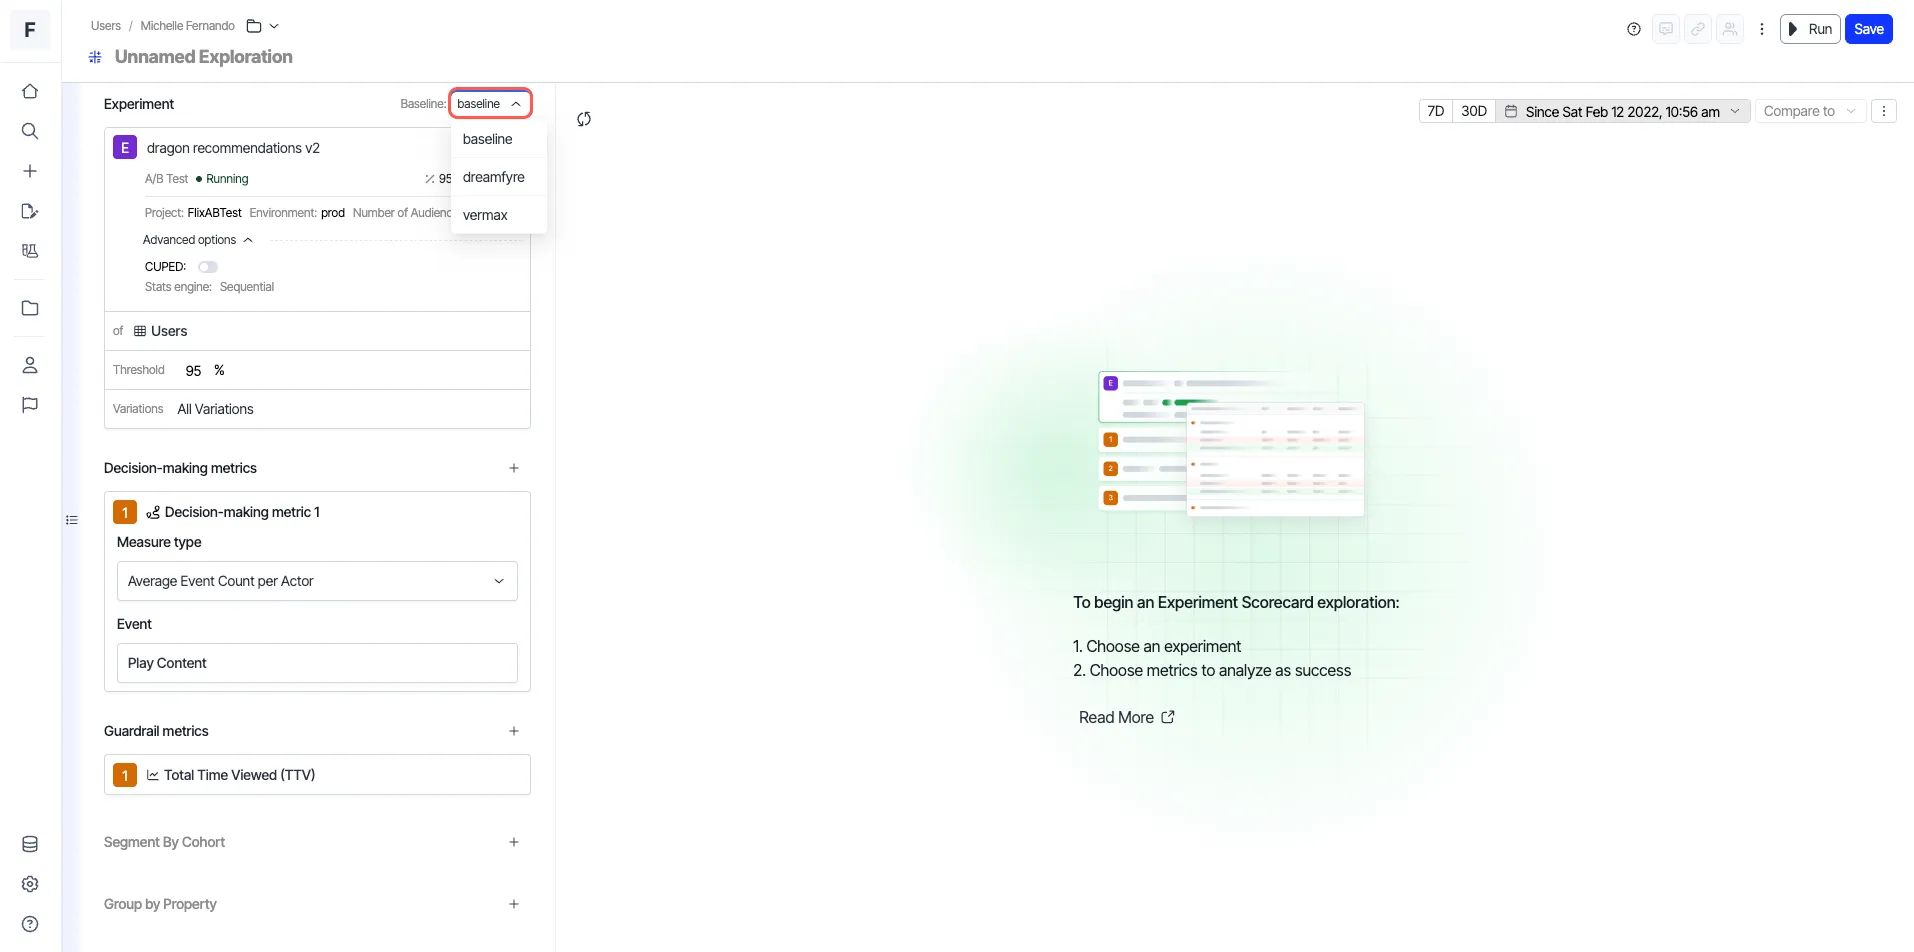
- Select a Baseline – it is the default variant against which other variants should be compared.
- Set the time range in the visualization window.
- Click Run to see your analysis. The scorecard displays a statistical significance table, showing which variation performed better based on the selected metrics. The resulting table has the following columns:
- Value – The percentage of unique visitors who triggered the event in the variation.
- Impact – The relative improvement in conversion rate for the variation over the baseline as a percentage for most experiments.
- Statsig – The statistical likelihood that the improvement is from changes you made on the page, not chance. Until Stats Engine has enough data to declare statistical significance, the results page states that more visitors are needed and shows an estimated wait time based on the current conversion rate.
- Confidence Intervals – Uncertainty around improvement. Stats Engine provides a range of values where the conversion rate for a particular experience lies. It starts wide, and as Stats Engine collects more data, the interval narrows to show that certainty is increasing. When a variation reaches statistical significance, the confidence interval lies above or below 0.
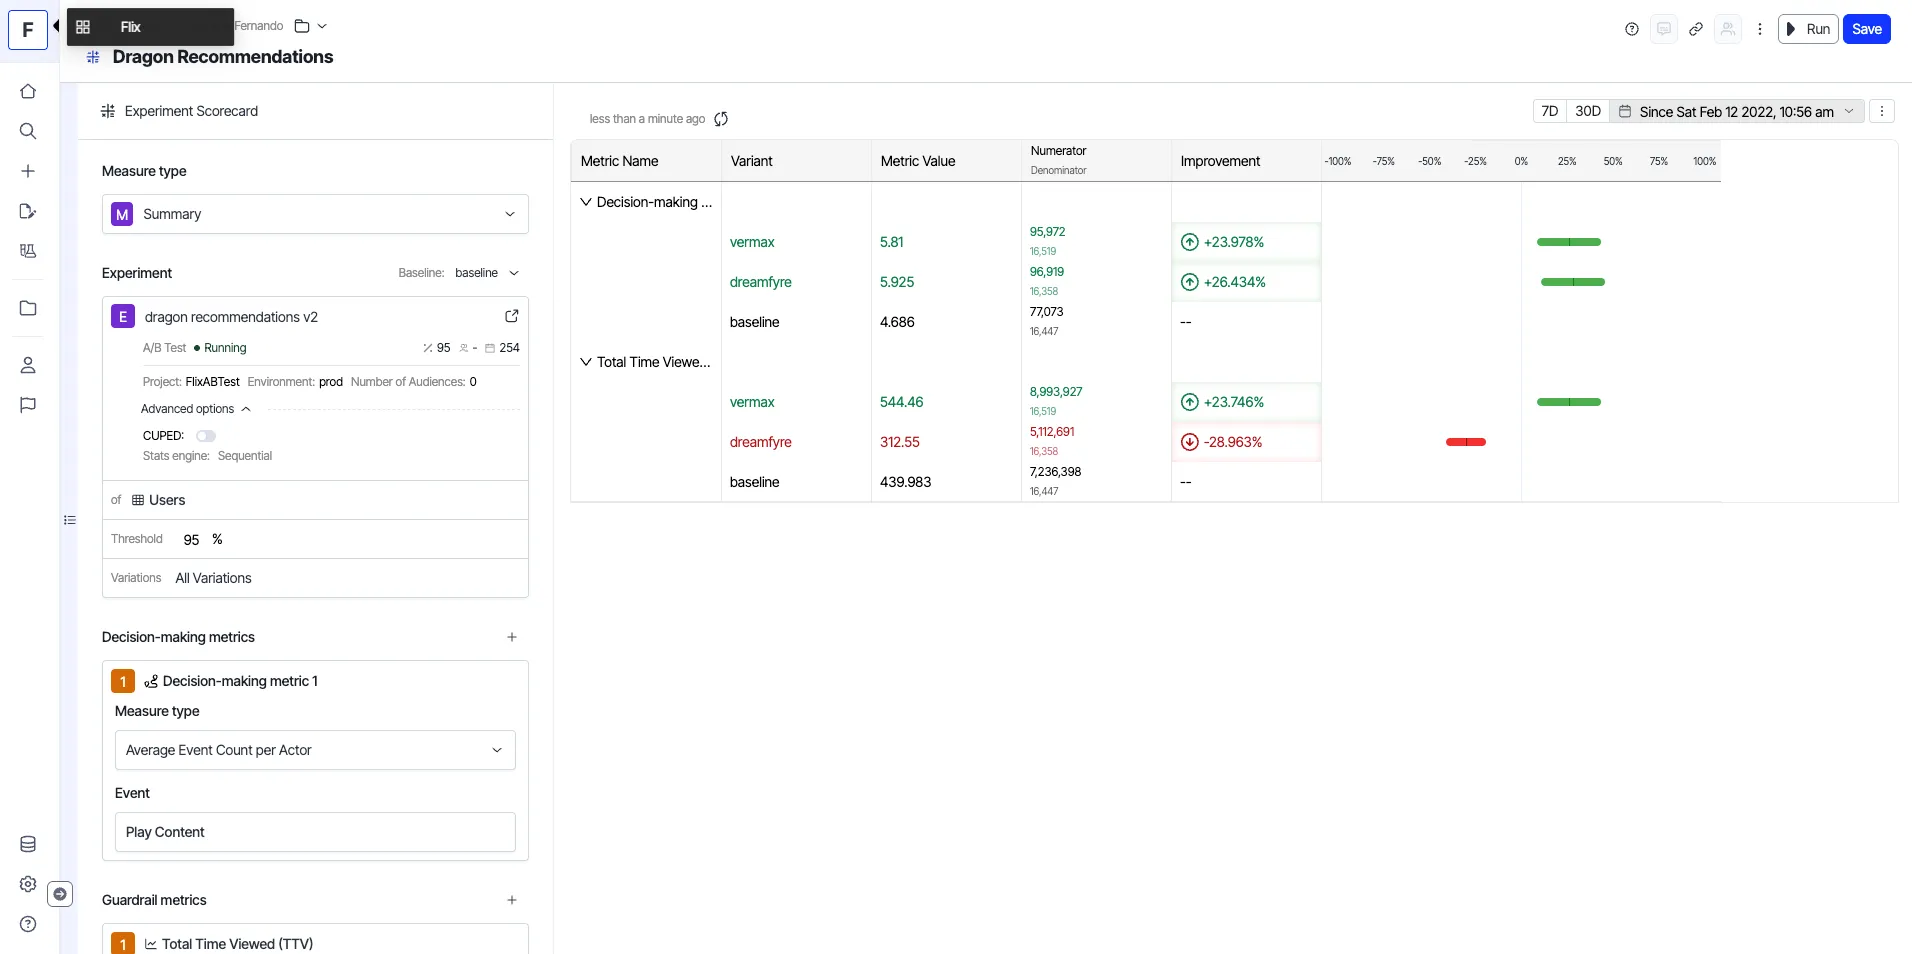
- Give a descriptive name to the analysis and save it.
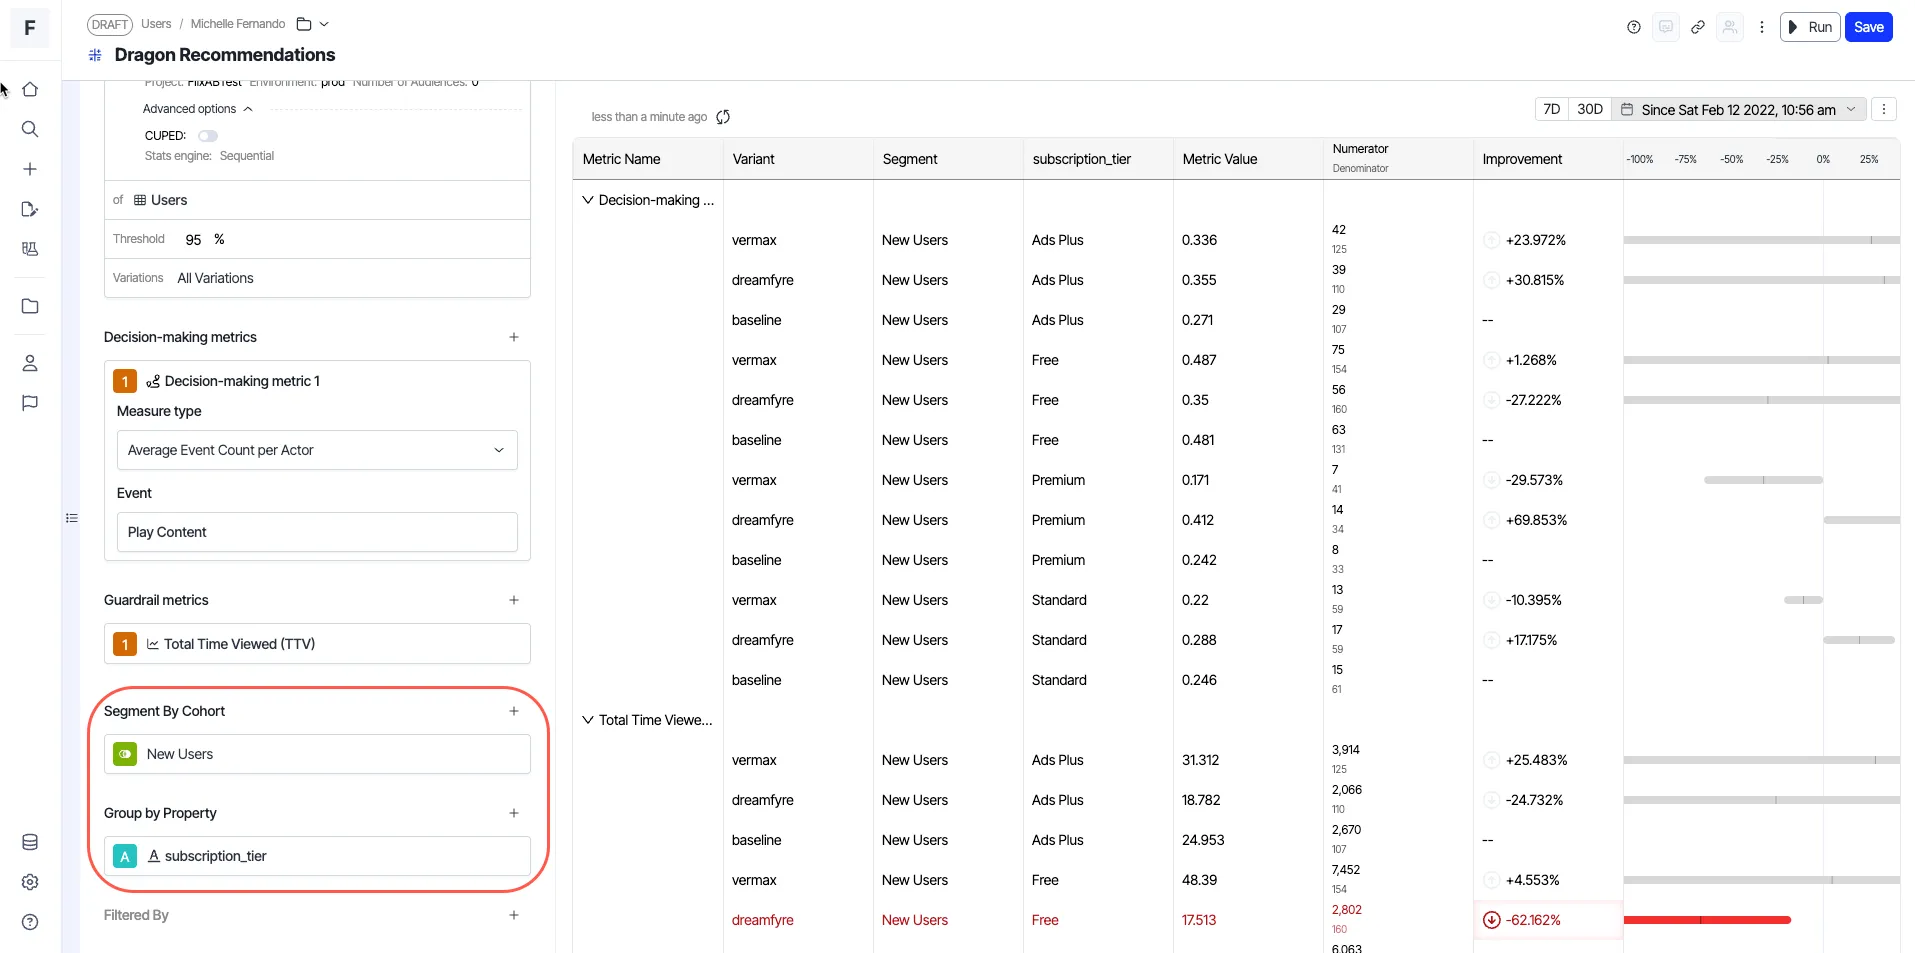
- (Optional) Segment your results by selecting additional cohorts. Select Performed by, Grouped by, or Filtered by, and select the options you want to segment by.
Analyze a Feature Rollout
Beta
Feature Rollouts is currently in beta. Contact your Customer Success Manager or sign up for the beta on Optimizely.com.
A Feature Rollout in Feature Experimentation releases one flag variation to a percentage of users who match its audiences. Analyze the rollout in an experiment scorecard to compare users who receive the variation with users held out. For example, measure whether users in a 30% rollout spend more than the other 70% of its audience.
To create a Feature Rollout, see Run Feature Rollouts in Feature Experimentation.
Create a scorecard for a Feature Rollout
Follow the steps in Configure the Experiment Scorecard and use the following settings:
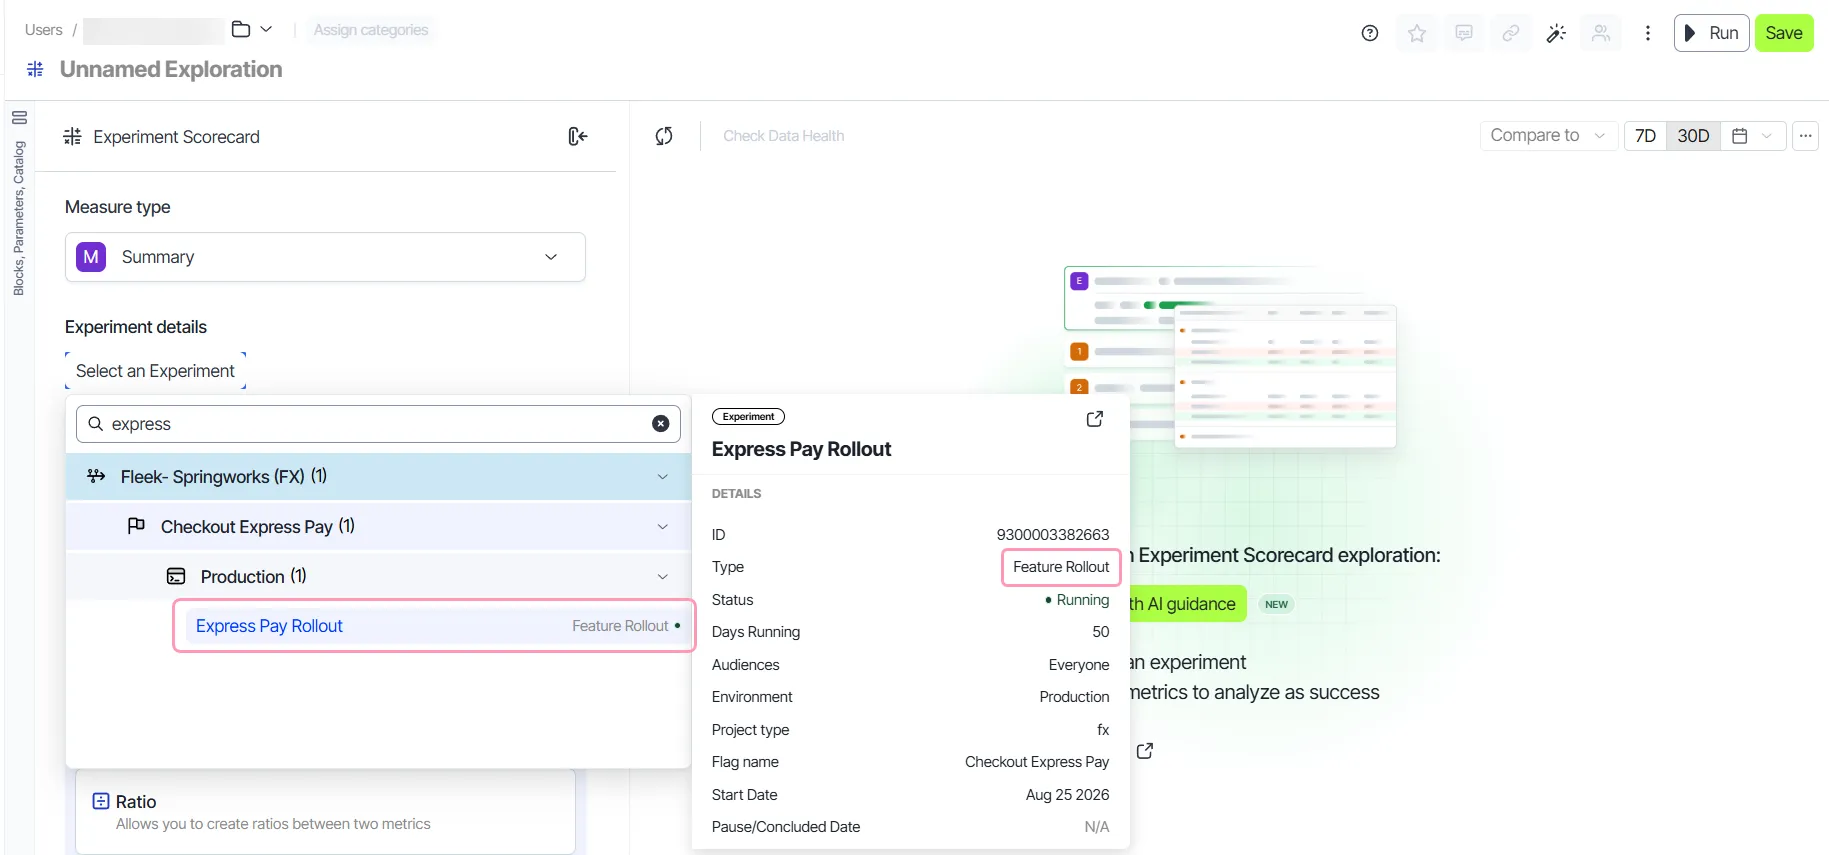
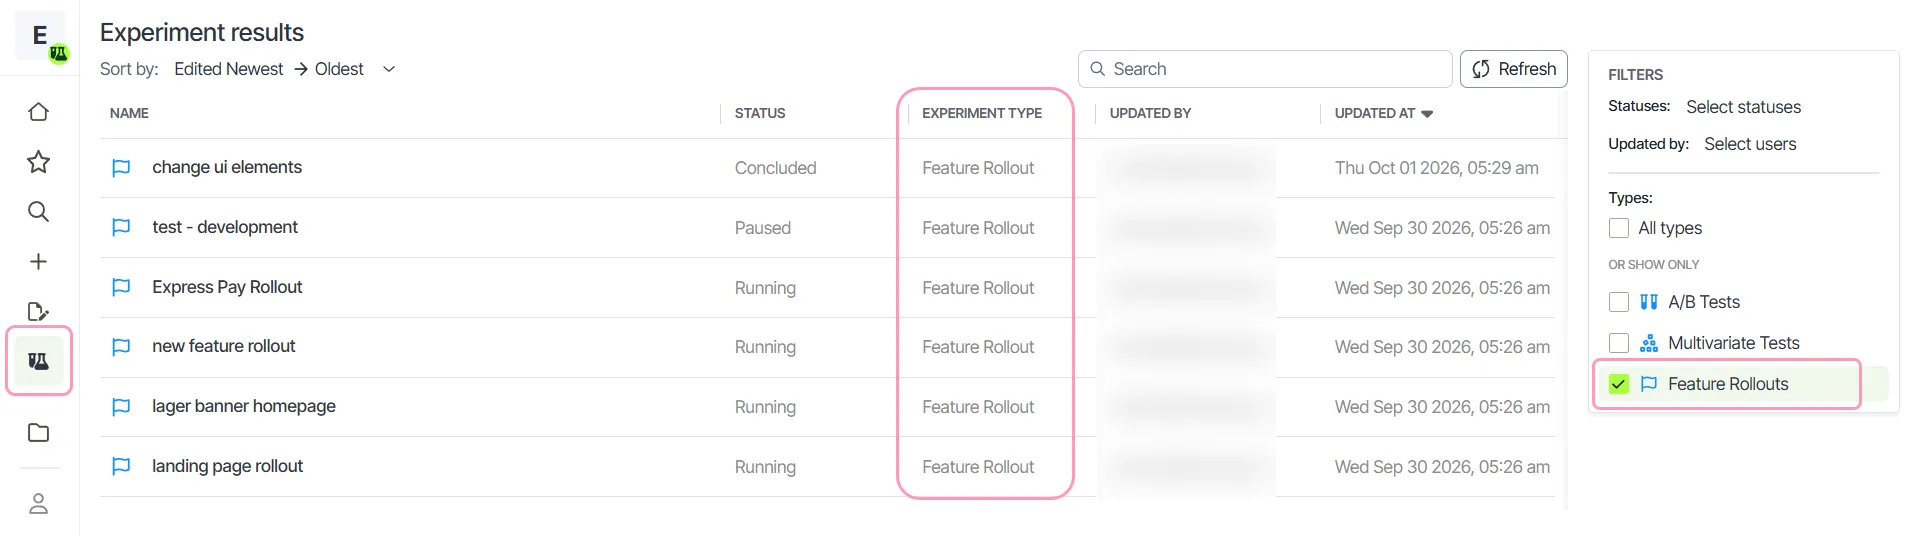
- Experiment – Select the rollout. The experiment list labels each rollout Feature Rollout.
- Baseline – Keep Off to compare the rollout variation with users held out of the rollout. Analytics selects Off by default.
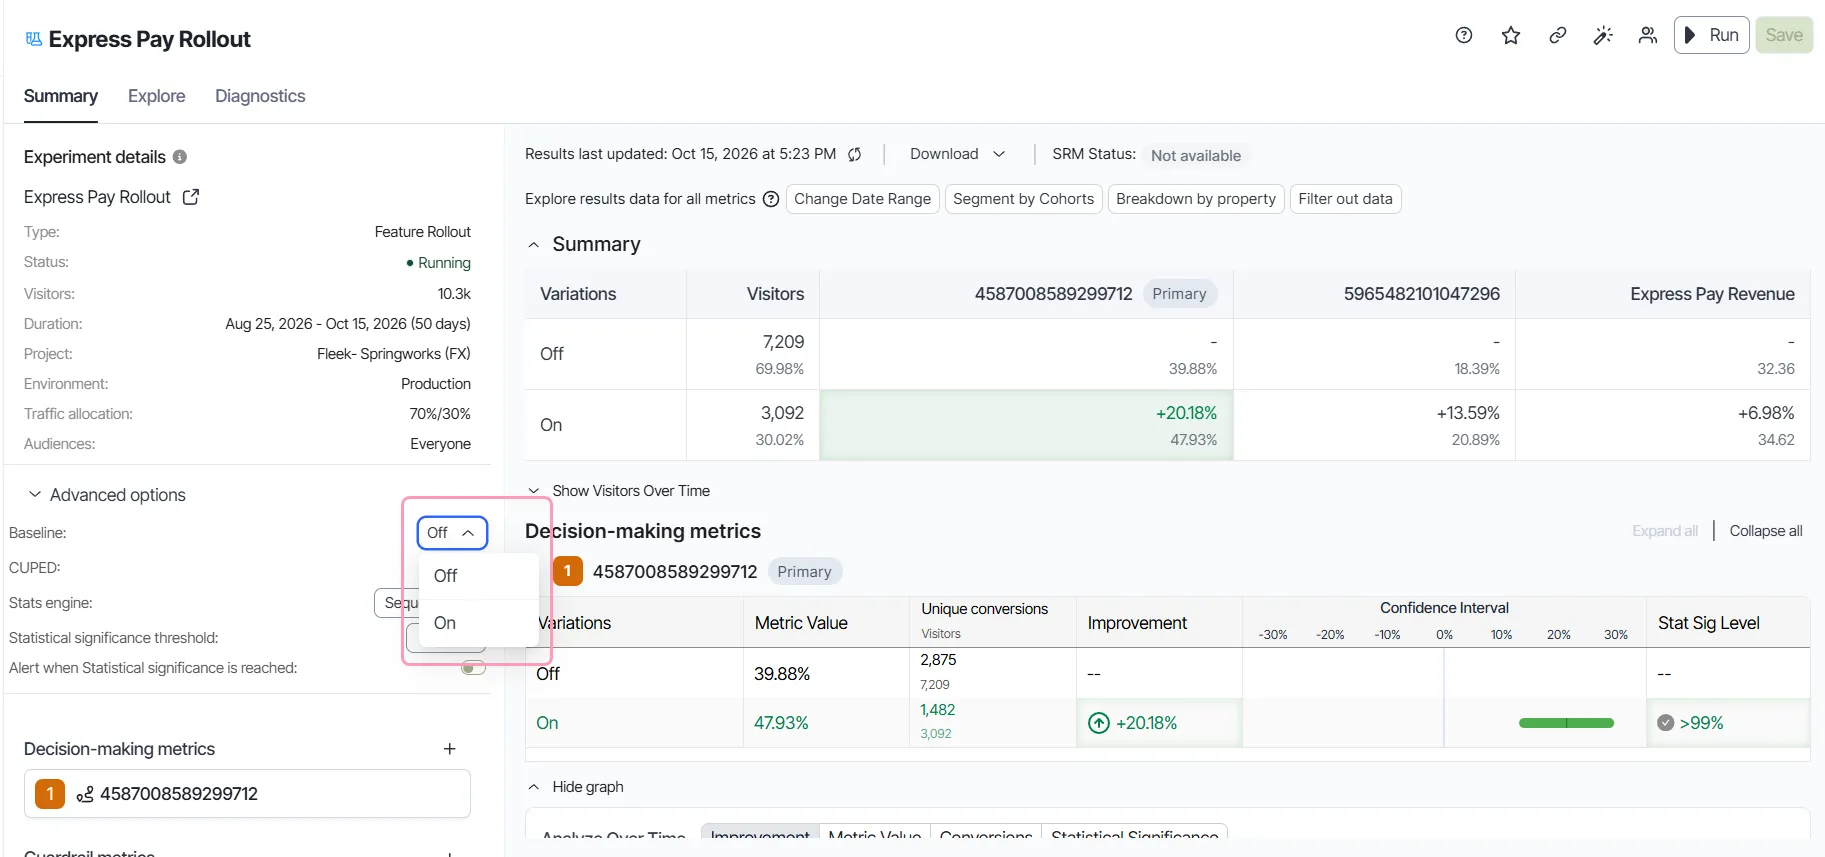
A Feature Rollout has no stats engine or significance settings in Feature Experimentation. For a rollout, the scorecard hides the stats engine, the significance threshold, and the statistical significance alert. Skip the threshold setting when you follow the configuration steps.
Feature Rollouts also display on the Experiments page. To list only rollouts, select Feature Rollouts in the Types filter.
Understand the Off baseline
A Feature Rollout lists only the variation it delivers. Analytics adds an Off variation for users held out of the rollout to give the scorecard a baseline. The Off variation covers the rest of the rollout's audience. For example, a rollout at 30% has an Off variation at 70%.
A rollout at 100% sends no users to Off. When the selected time range has no Off data, the scorecard reports metrics for the rollout variation without a comparison. This single-variation view covers a rollout created at 100% and any time range after a ramp to 100%. Use this view to monitor business metrics after a full release.
A rollout ramped up to 100% still has Off data from before the ramp. Include those days in the time range to compare the rollout variation with Off.