Usage and billing dashboards
The Usage & Billing dashboards in the Opti ID Admin Center provide a central location to monitor your usage and billing data for all your Optimizely products. The dashboards are available for the following Optimizely products:
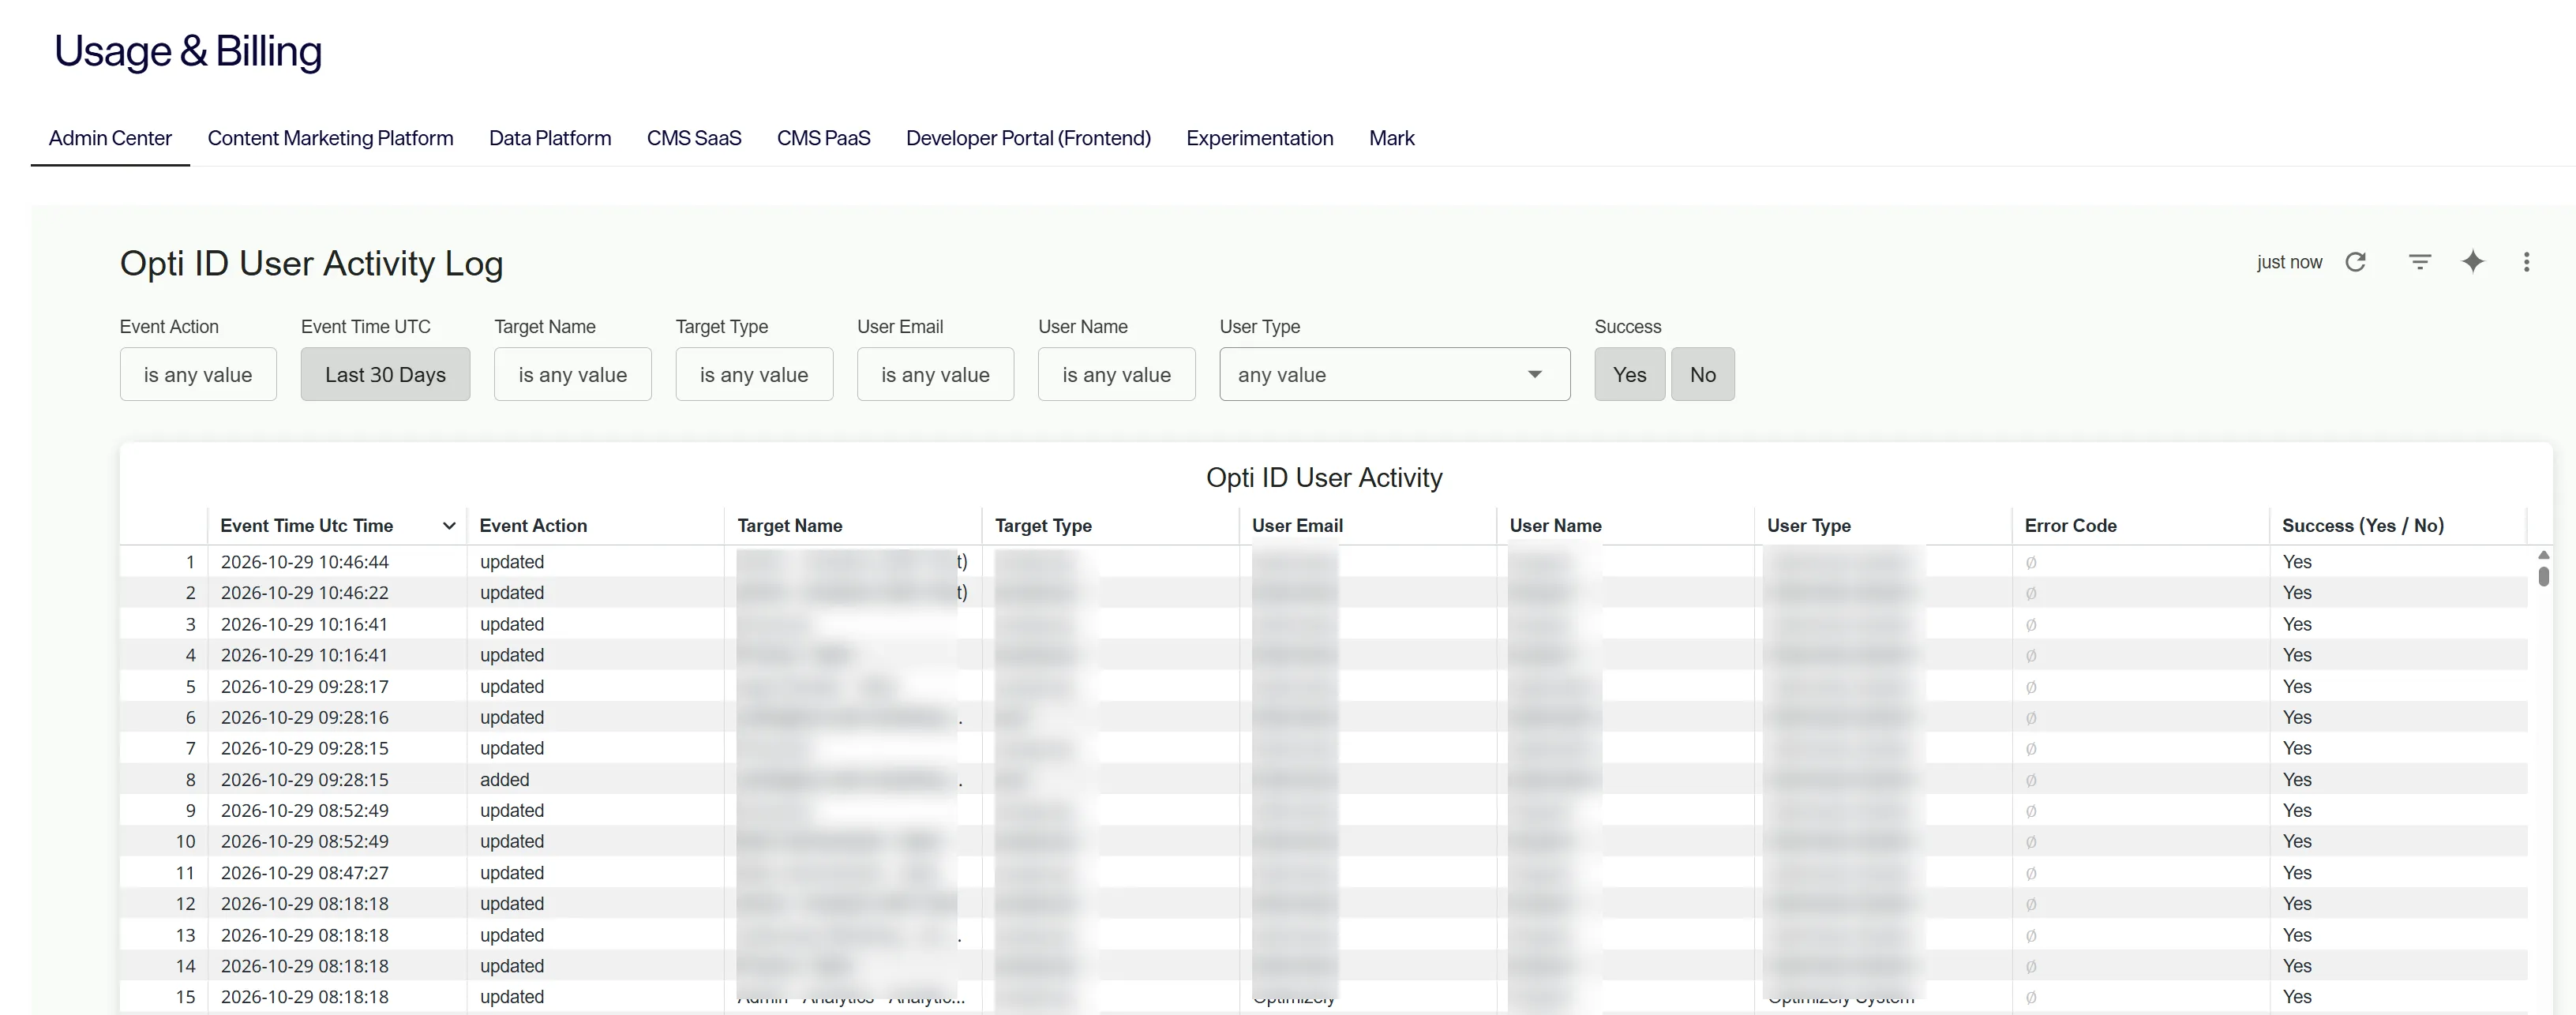
- Admin Center
- Configured Commerce
- Content Marketing Platform (CMP)
- Content Management System (CMS)
- CMS (SaaS)
- CMS (PaaS)
- Developer Portal (Frontend)
- Data Platform
- Experimentation
- Mark (Optimizely Agent Platform)
Prerequisites
- Must have Opti ID.
- Must have the Super Admin or Billing Admin Opti ID roles.
View usage and billing data
In the Opti ID Admin Center, go to Usage & Billing. If you have multiple Optimizely products, you must select the correct product tab to view usage and billing data specific to that product. The dashboards and metrics you see depend on the products and contract you have.
Important
Any time you change a filter, you must click Reload to apply it. The dashboard does not update until you do.
For more information on filtering, downloading, and other dashboard actions, see Work with dashboards.
Experimentation
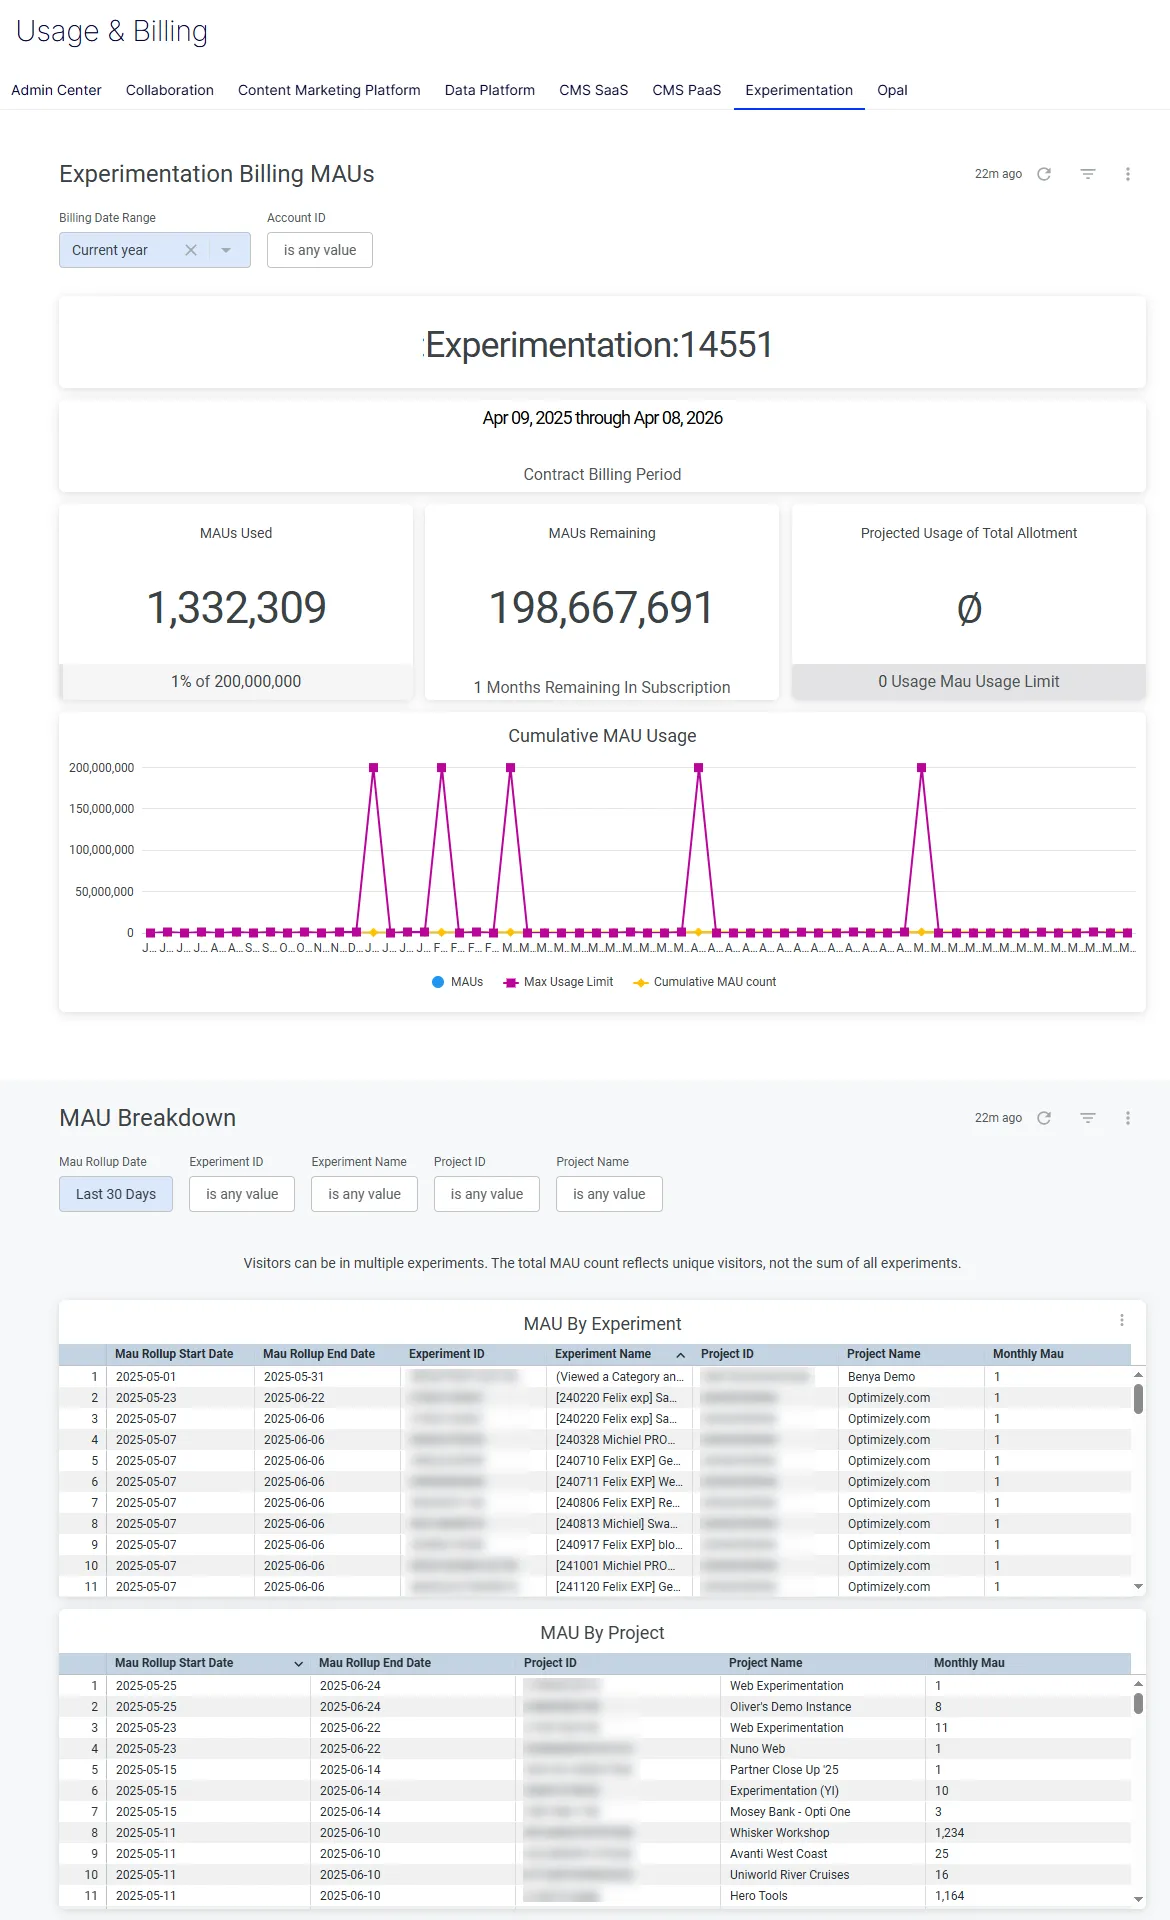
The Optimizely Experimentation usage and billing dashboards provide a detailed view of your usage. The dashboard shows data for the metric your contract is based on. For example, if you purchased monthly active users (MAUs), you see MAU data. The data is pulled every 24 hours and can take up to 3 hours to display in the dashboard. You can view the following MAU information:
- The number of total MAUs your account has used.
- The number of MAUs your account has left to use.
- Your projected usage of the total allotment.
- A graph of your cumulative MAU usage.
- A table that lists the MAU usage by experiment.
- A table that lists the MAU usage by project.
Note
If your contract is based on impressions, a legacy metric, the dashboard shows impressions data instead. The dashboard displays almost the same information as for MAUs.
Mark
The Mark usage and billing dashboards provide a detailed view of your credit consumption. You can see how many credits your organization has used and has left, how your balance changes over time, and which users and agents consume the most credits.
Agent Platform Insights
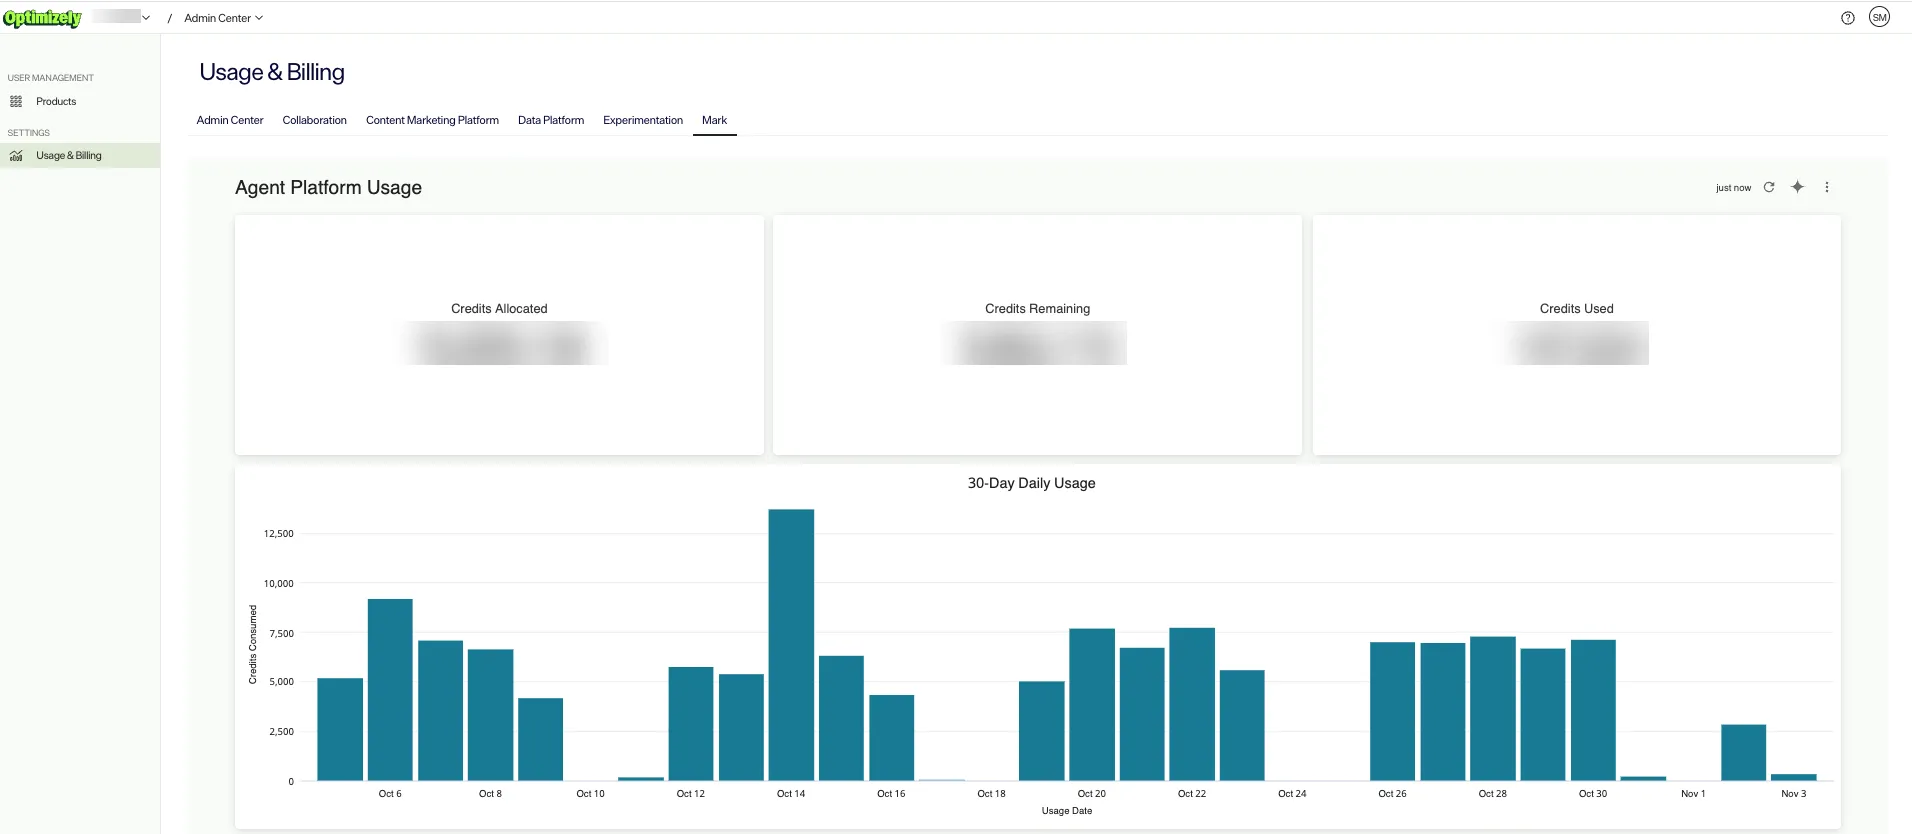
The Agent Platform Insights dashboard gives you an overview of your credit consumption so you can manage your credit allocation. The dashboard includes the following data:
- Credits Allocated – The total number of credits Optimizely allocated to your organization for your contract period.
- Credits Remaining – The number of credits remaining after consuming credits from the total number of allocated credits.
Note
Credits Remaining stops at 0 and never displays as a negative balance. Optimizely still tracks any usage beyond your allotment, and you can view it in the Credits Used section.
- Credits Used – The total number of credits used in the selected date range.
- Daily Usage – A bar chart with the total credits consumed on each usage date. Use this chart to spot days with unusually high consumption.
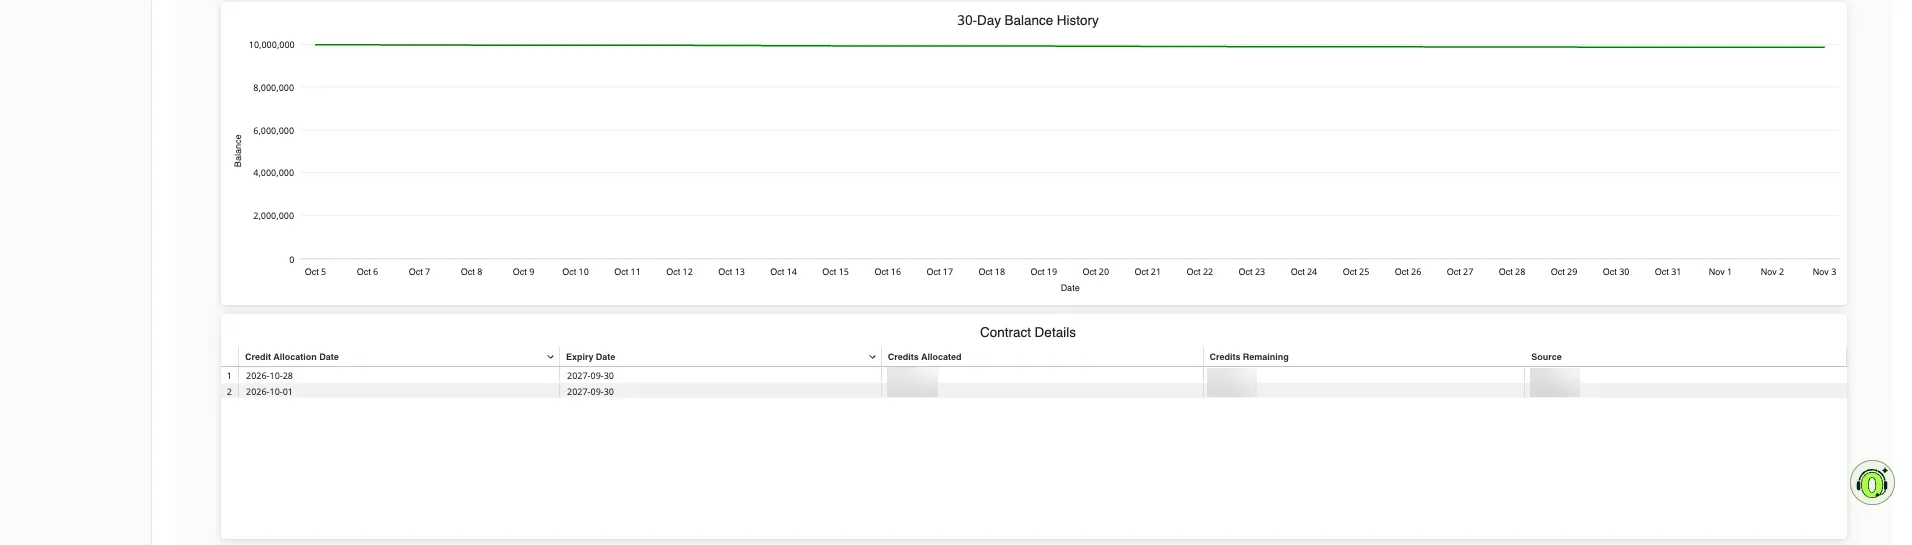
- 30 Day Balance History – A line chart with the credit balance history for the past 30 days. Hover over the line to view the Date, the credit Balance on that date, and the Change in your balance compared to the previous day. Use this to track daily changes in your credit balance to support improved planning.
- Contract Details – The details of your Mark credits allocation, including the following data:
- Credit Allocation Date – The date on which your credits were allocated by Optimizely.
- Expiry Date – The date on which your credits expire.
- Credits – The total number of credits allocated.
- Credits Remaining – The total number of credits remaining after usage. This value stops at 0.
- Source – The type of credits allocated (Paid, Monthly Free, and Bonus).
Note
If additional credits are allocated during your contract period, each batch is displayed in a separate line, helping you track usage across multiple allocations easily.
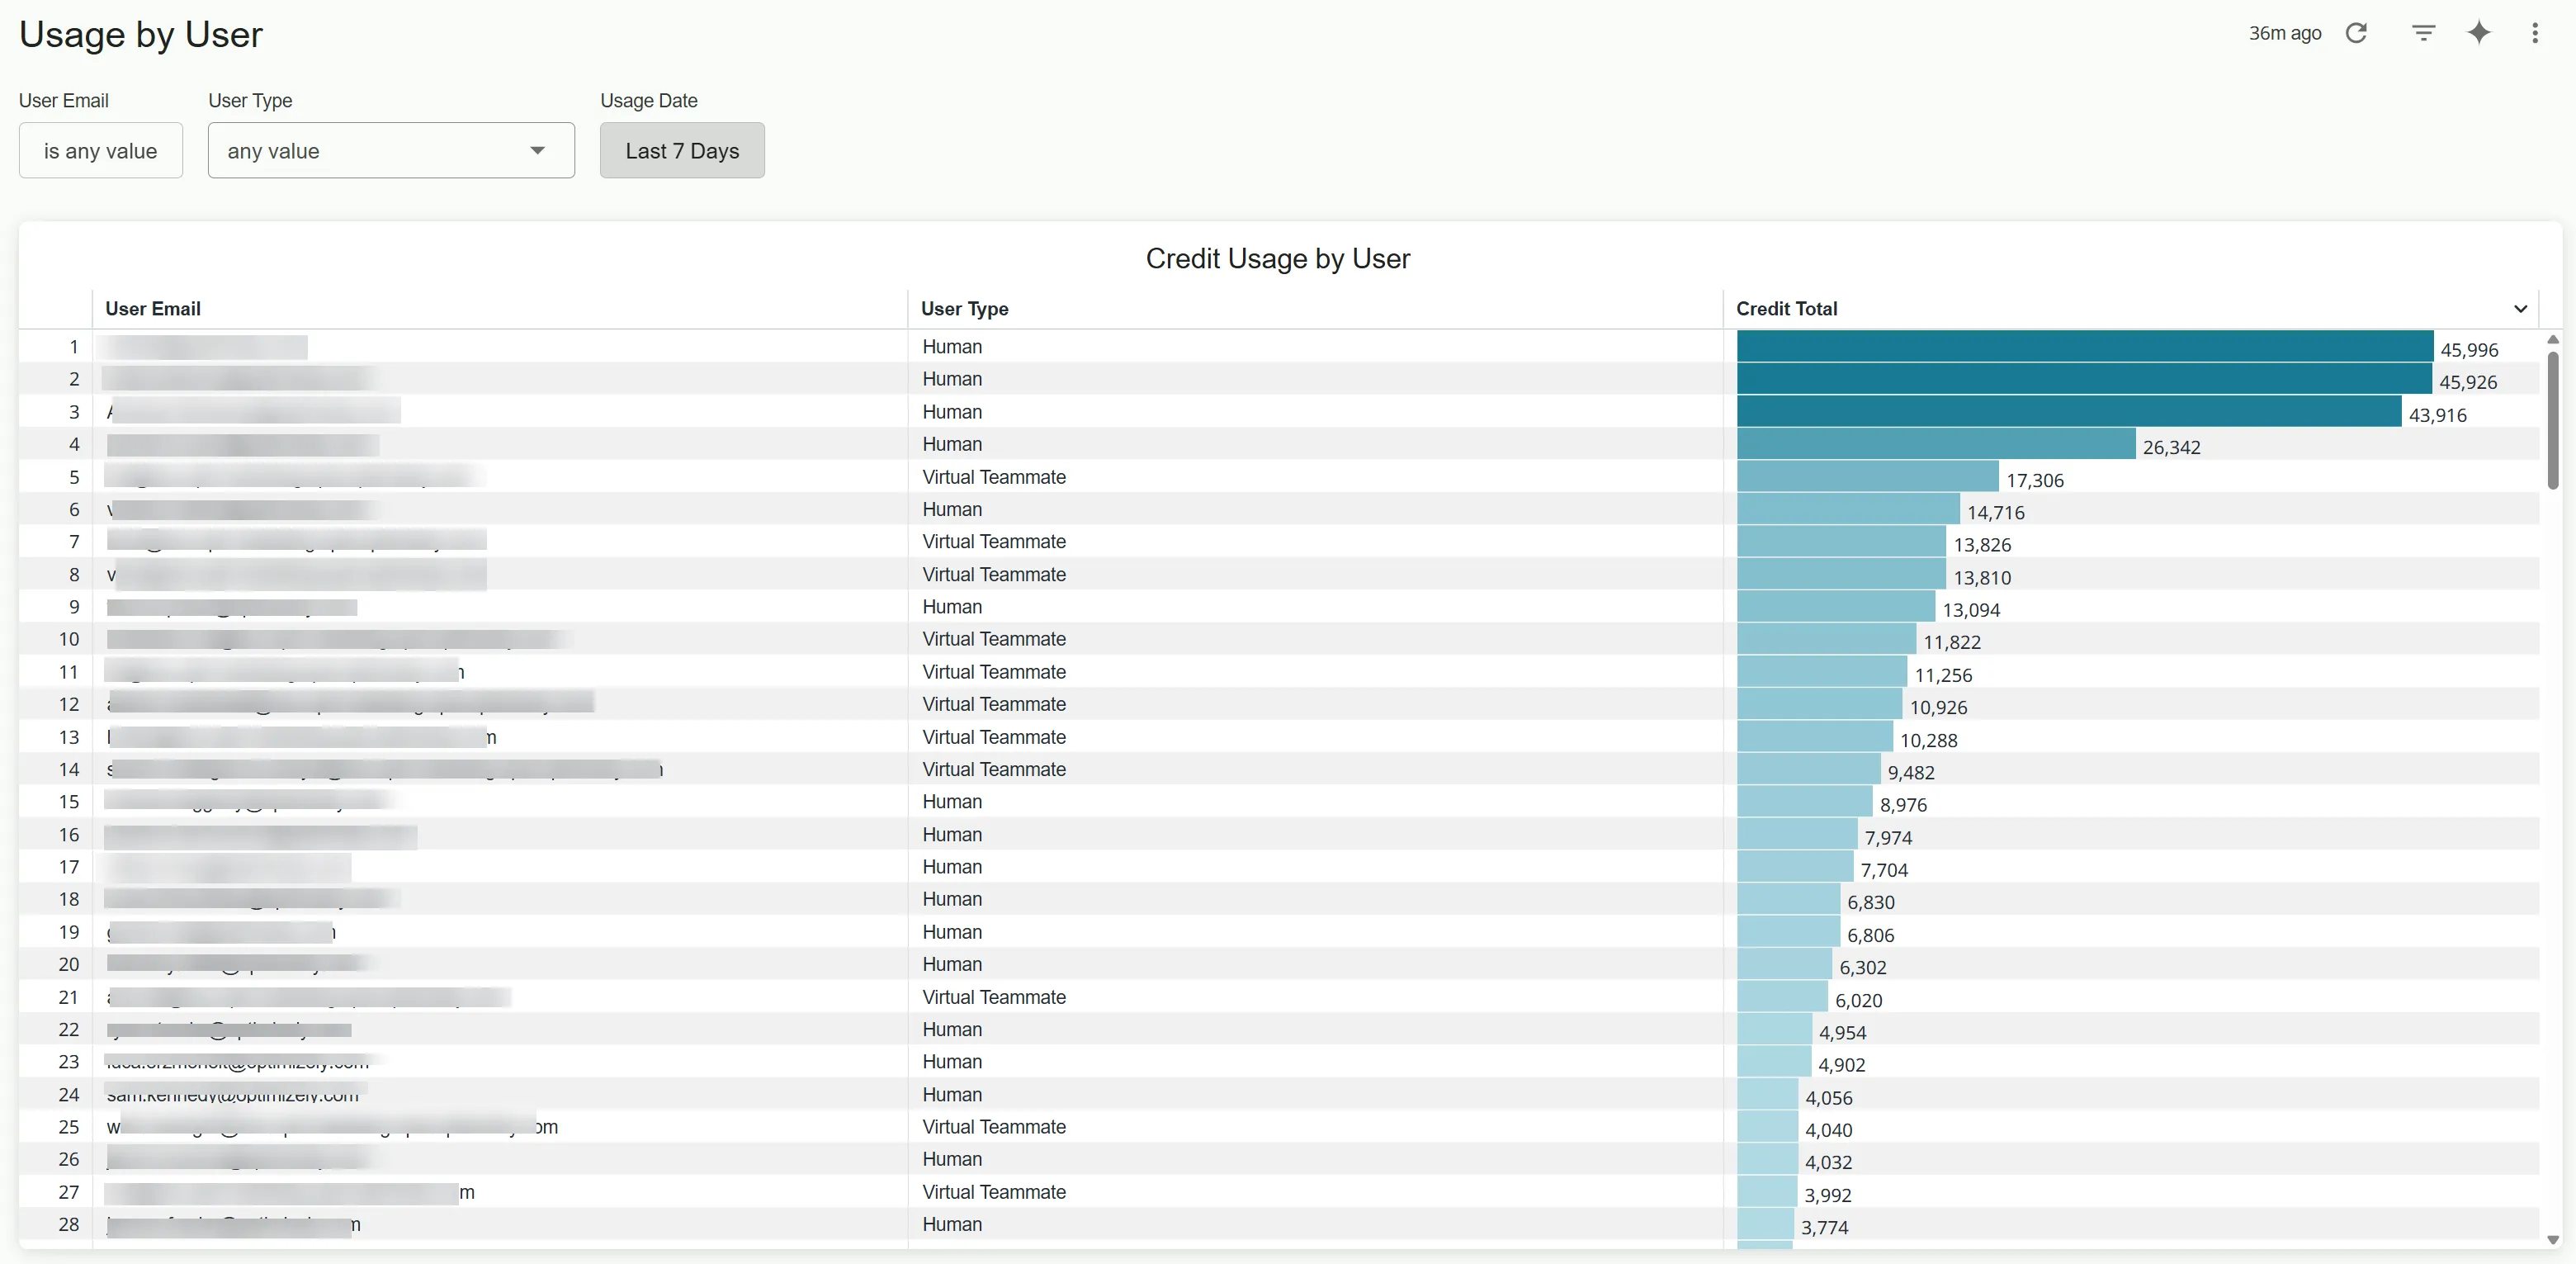
Usage by User
The Usage by User section shows how many credits each user account consumed. Use the User Email, User Type, and Usage Date filters to narrow the data. The default date range is Last 7 Days.
The Credit Usage by User chart lists each User Email with its User Type and Credit Total. Use this chart to identify high-usage accounts and monitor consumption trends.
Usage by Agent
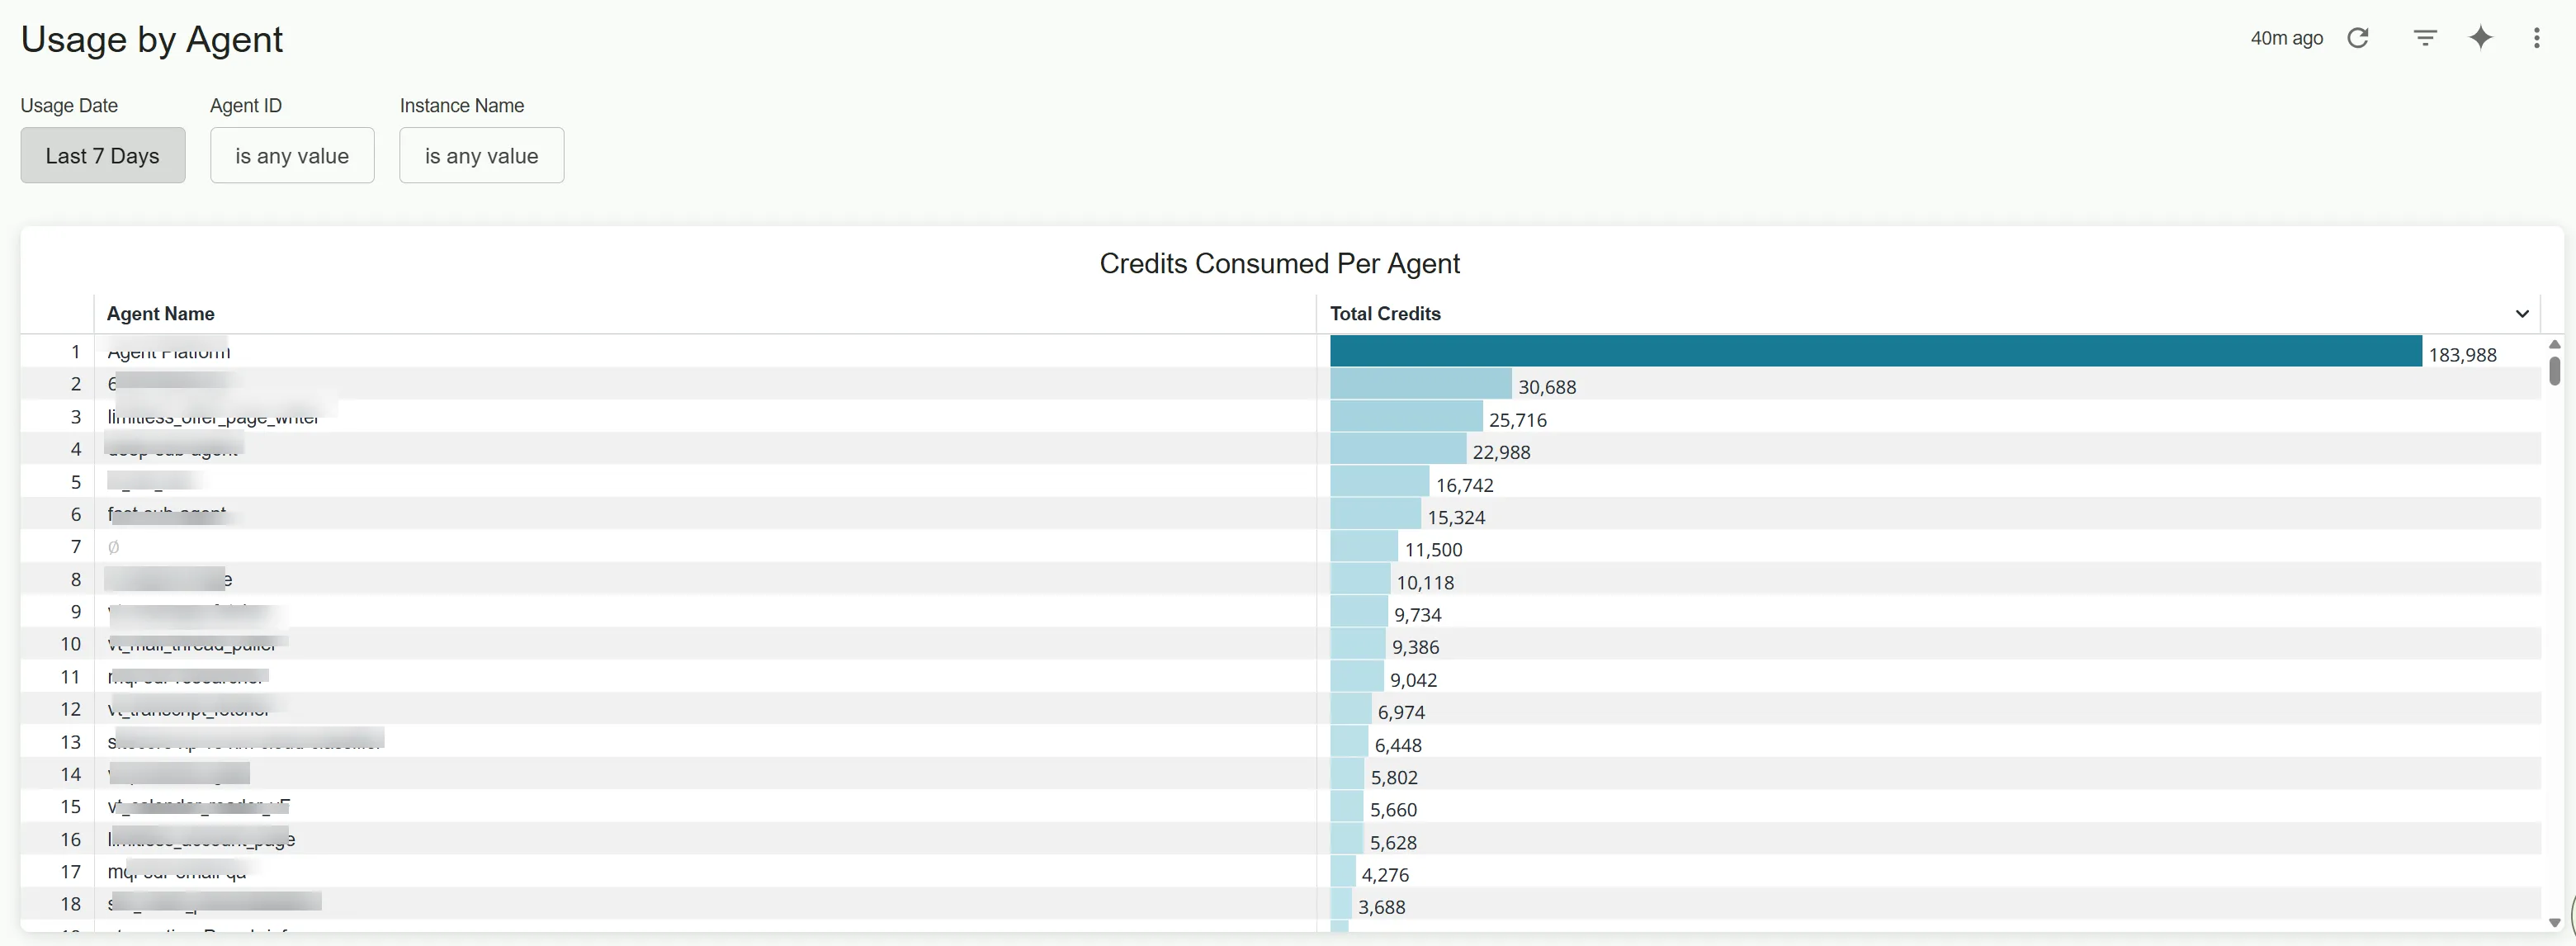
The Usage by Agent section shows how many credits each agent consumed. Use the Usage Date, Agent ID, and Instance Name filters to narrow the data. The default date range is Last 7 Days.
The Credits Consumed Per Agent chart lists each Agent Name with its Total Credits. Use this chart to find the agents that use the most credits.
Agent Usage
The Mark Agent Usage dashboard displays a table that lists the agent IDs (@names) in your product instances and the total number of credits each agent consumed.
Note
If you see Agent Platform in the agent list, that is the primary chat agent, which is Mark itself. Its credits are the credits consumed by general chat interactions, not by a custom agent.
For more information about how people in your organization use Mark, such as adoption data, see Optimizely Reporting for Mark.
Other products
If you have any of the following products, select the product tab in Usage & Billing to view its usage and billing dashboard.
- Data Platform – View monthly bar graphs for monthly active users (MAUs), unique visitors (UVs), email sends, SMS sends, and MMS sends. Use the Contract Dates filter to view a different contract year.
- Configured Commerce – View your transaction usage. A transaction is any order, quote, or requisition that is submitted through your Configured Commerce site or API and moves to Submitted status.
- Content Marketing Platform (CMP) – View your named users by type (Admin, Collaborator, Creator, Guest, and Custom), a rolling 30-day chart of named user usage, and your peak historic named user usage. CMP also supports billing notifications.
- CMS (PaaS) – View your usage, usage remaining, and projected usage for the selected billing period, along with your contract's unit of measure and a chart of usage by month. Usage is counted across all of your environments, such as production, integration, and preproduction.
- CMS (SaaS) – View your named users, a chart of named users for the last 30 days, peak named users by month, and content items by month. A content item is an experience or media item that is indexed in Optimizely Graph. Named users are people you authorize to use CMS (SaaS). A user with access to multiple CMS instances is counted only once.
- Developer Portal (Frontend) – View your total visits for the contract billing period and a chart of monthly visit totals.
Enable billing notifications
Optimizely Experimentation, Content Marketing Platform (CMP), and Mark support billing notifications, which help you track your application usage throughout the month and avoid additional charges. Complete the following steps to enable billing notifications for specific users in your organization:
- In the Opti ID Admin Center, go to Settings > Notifications.
- Turn on notifications for the product or products you want.
- Add the people in your organization who should receive them.
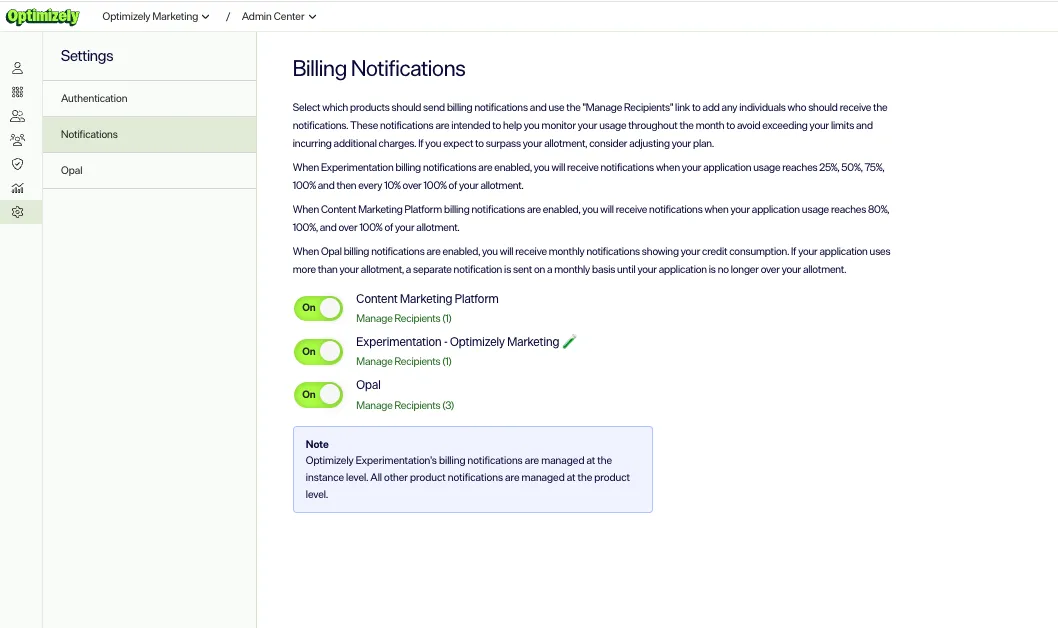
See the following details on product-based notification settings:
- Experimentation – Notifications are sent when your application usage hits 25%, 50%, 75%, 100%, and every 10% beyond 100% of your allotted usage.
- CMP – Notifications are sent when your application usage reaches 80%, 100%, and over 100% of your allotment.
- Mark – Credit usage notifications are sent monthly. An additional notification is sent if your application usage exceeds 100% of your allotment, and continues to be sent monthly as long as your application usage is over 100%.
These notifications do not prevent you from exceeding your allotted usage. They only make it easier for you to monitor your usage.
Work with dashboards
Download a dashboard
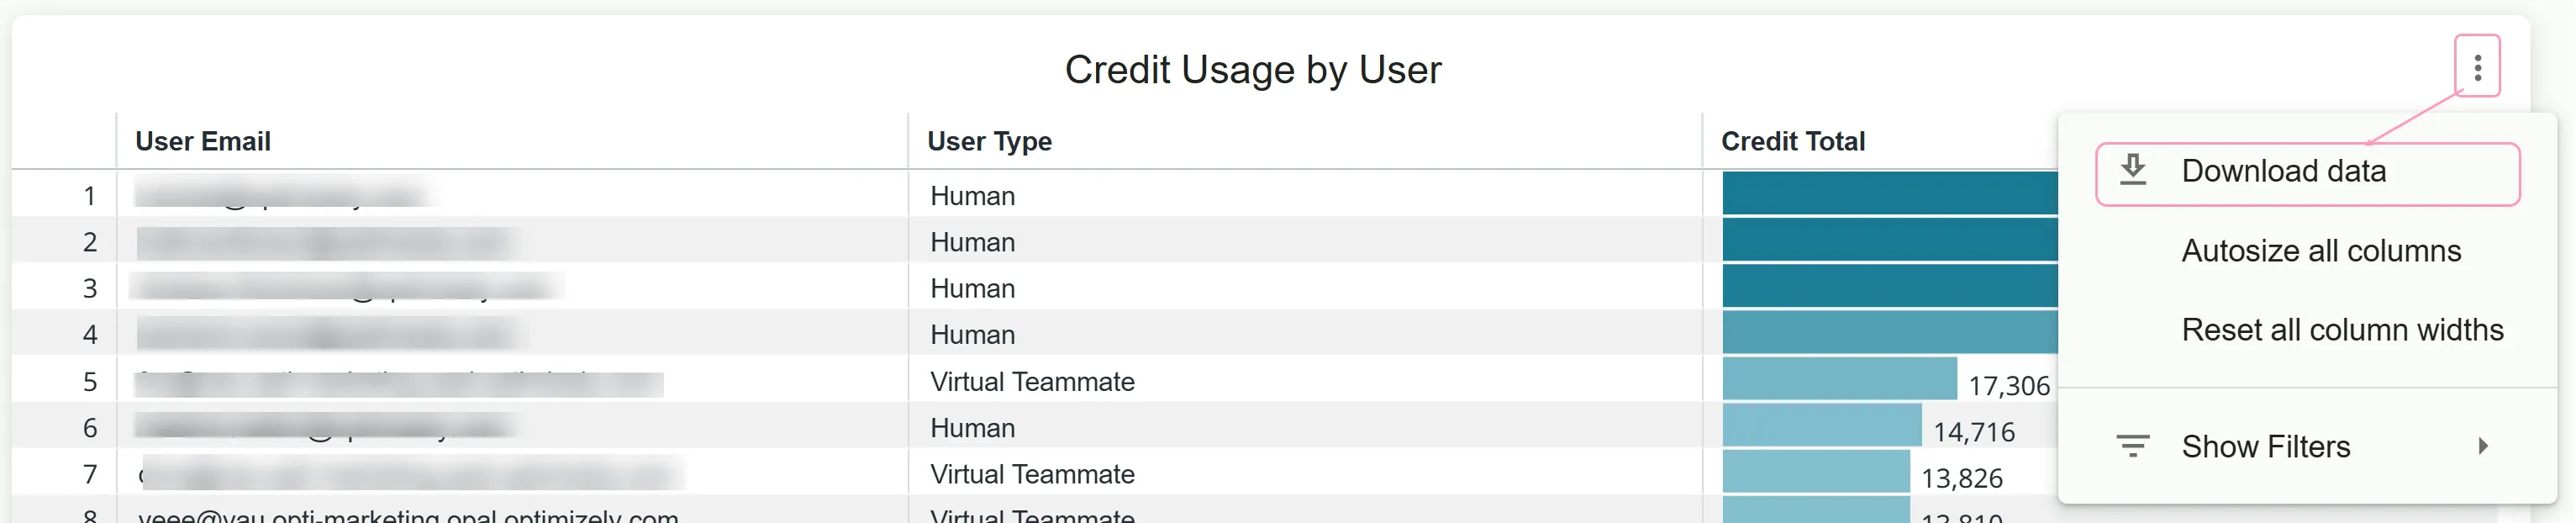
You can download data from two places: a specific dashboard tile, or the entire dashboard. To download all of the data behind a tile, use the tile download.
Download data for a dashboard tile
- Click Tile actions > Download data.
- Select your desired Format.
- (Optional) Expand the Advanced data options section and adjust how to format the data for the download.
Note
By default, the download includes only the first 5,000 rows displayed. To download all available data, expand Advanced data options and select the option to include all results.
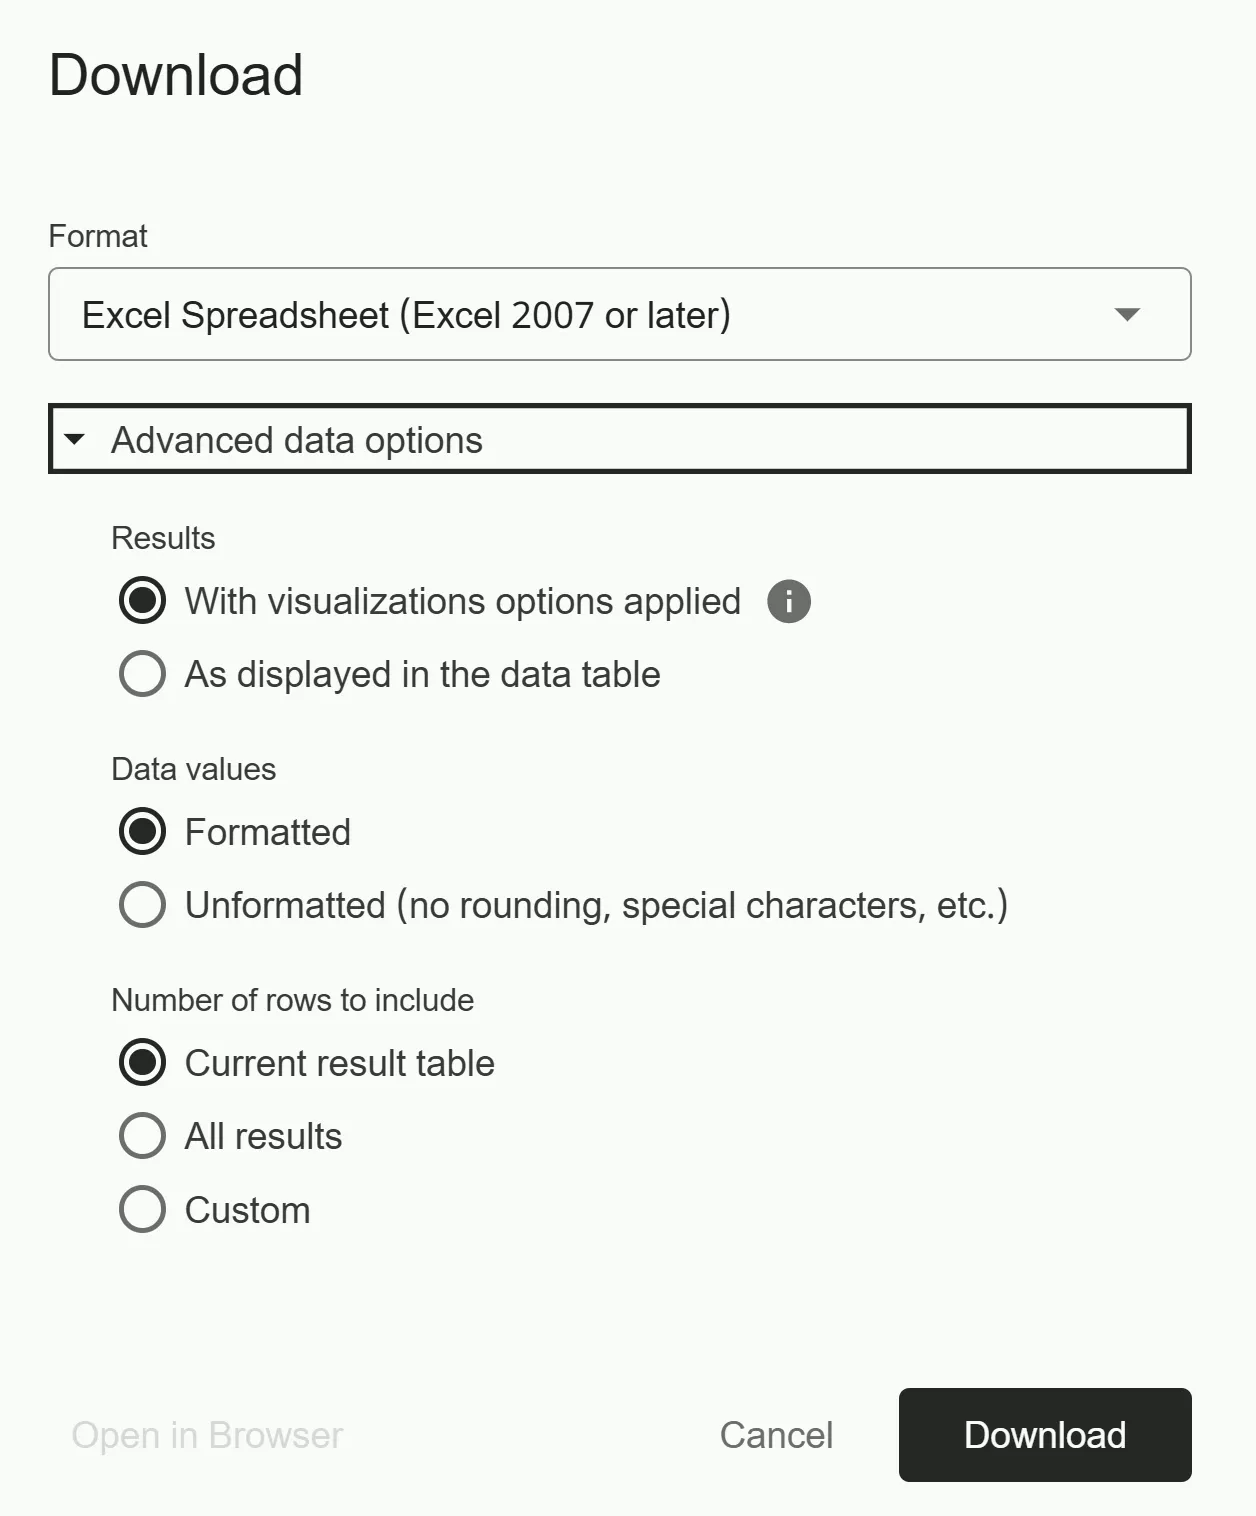
- (Optional) Click Open in Browser to view the results in a new browser tab. This is not available for all formats.
- Click Download.
Download the entire dashboard
- Click Dashboard actions > Download.
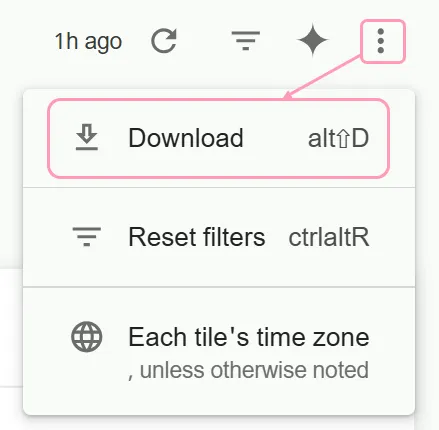
- Complete the following fields:
- Format – Select PDF or CSV.
- PDF – Generates one file for the entire dashboard.
- CSV – Generates a file for each tile within the dashboard.
- Paper Size – Select Fit Page To Dashboard, Letter, Legal, Tabloid, A0, A1, A2, A3, A4, or A5. For more information on A paper sizes, see papersizes.org.
Note
An additional Orientation option (Portrait or Landscape) displays for Letter, Legal, and Tabloid.
- Expand tables to show all rows – Select this checkbox to display all rows in each table.
- Arrange dashboard tiles in a single column – Select this checkbox to display dashboard tiles in a single column.
- (Optional) Click Open in Browser to view the results in a new browser tab. This is only available for PDF format.
- Click Download.
Filter the data
By default, the dashboard displays usage and billing data for the current year. If you have a multi-year contract, you can adjust this filter to view data from a different contract year. The last time the system refreshed the data displays at the top.
Important
Any time you adjust the filters, you must click Reload to apply your new filters.

Click Hide filters to collapse the filters so they do not display on the dashboard.

Reset dashboard filters
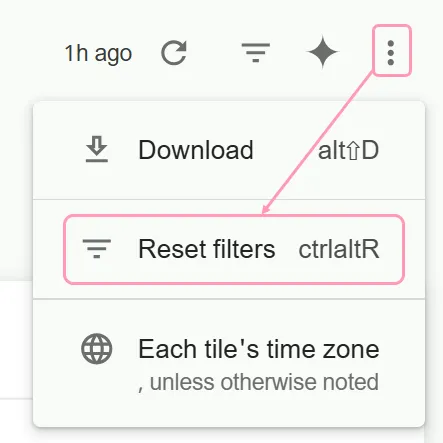
To clear the current filter settings and reset to the default filter, click Dashboard actions > Reset filters. The dashboard automatically reloads to display data for the default filters.
Update the time zone
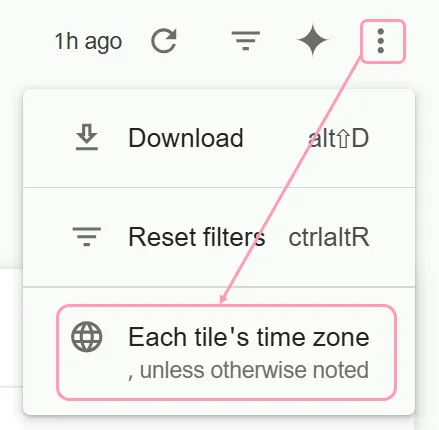
If you want to change the time zone for your dashboard, click Dashboard actions > Each tile's time zone. Select your desired time zone from the drop-down list, then click Update.
Expand dashboard tiles
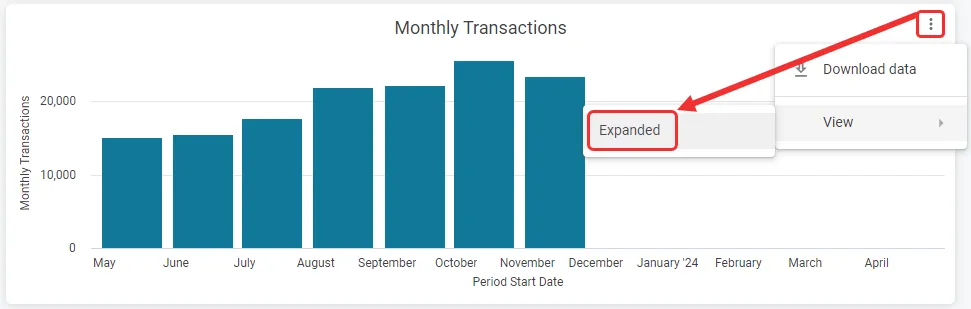
To expand a tile on a dashboard, click Tile actions > View > Expanded. From the expanded view, use the left and right arrows to scroll through other dashboard tiles.

You can also make the dashboard tiles full screen. Click Tile actions > View > Full Screen. Click Close or press Escape on your keyboard when done.
FAQs
General
Why is there no data in the dashboard after I changed a filter?
Click Reload to apply your filter changes. The dashboard does not update until you do.
I cannot see all of my data in a downloaded file. How do I download everything?
Download from the dashboard tile instead of the entire dashboard. Click Tile actions > Download data, expand Advanced data options, and select the option to include all results. For more information, see Download a dashboard.
Experimentation
Why is there no data when I filter to a recent date range, such as Last 7 days?
MAUs are not broken down by day. They are rolled up to specific dates. If the last rollup date is outside the date range you select, the dashboard has no data to show. Select a longer date range, such as Last 14 Days, that includes the most recent rollup date.
Why is my projected usage lower than my actual usage?
The projected usage calculation does not include the current month. If your MAUs or impressions changed significantly this month, that change is not yet reflected in your projection.
How current is my Experimentation data?
Data is pulled every 24 hours and can take up to 3 hours to display in the dashboard, so expect a lag of about 27 hours.
Will my MAU count double if I use both Web Experimentation and Feature Experimentation?
Not if you identify the same user the same way in both products. Optimizely aggregates all consumption into a single count of unique users, and de-duplicates a user only when both products use the same user ID for that person. For example, if Feature Experimentation has three unique users (Bob, Larry, and Mo) and Web Experimentation has two (Larry and Mo), and both products identify Larry and Mo with the same user IDs, your MAU count is three. If the products identify the same person with different IDs, such as an anonymous Web Experimentation ID and a known Feature Experimentation ID, Optimizely counts them as separate users.
To avoid overcounting, override the anonymous Web Experimentation user IDs with your known Feature Experimentation user IDs. For more information, see De-duplication.
How are MAUs calculated in Web Experimentation?
Each unique visitor who loads a page that has the Optimizely snippet is counted as one MAU for the month, even if the snippet is empty or the visitor does not see an experiment. A visitor who returns multiple times in the same month is still counted once. If you do not want Optimizely Web Experimentation to run on a specific page, remove or disable the snippet on that page.
Why does the MAU breakdown not show a project name?
If you use custom snippets, the snippet can contain experiments from multiple projects. In this case, the breakdown shows a row for each custom snippet instead of each project.
CMS (PaaS)
The following answers apply to contracts that are measured in pageviews. To see the unit your contract uses, check the Unit of Measure tile on the dashboard.
Where does pageview data come from?
Optimizely calculates pageviews from the data captured by Azure Application Insights. Usage is counted across all of your environments, such as production, integration, and preproduction.
Why are my pageviews high?
Optimizely cannot filter a pageview after it is recorded. Third-party elements that load in an iFrame, such as ad networks, are captured as part of the full page render and are counted as pageviews. If you suspect bot traffic is inflating your count, submit a support ticket to enable or modify bot blocking at the web application firewall (WAF) level. This blocks bots before the pageview is recorded.
Why are my pageviews higher than what Google Analytics 4 (GA4) shows?
GA4 and Azure Application Insights are built for different purposes, so their counts differ. Do not compare the data. The following are common reasons:
- Bot and crawler filtering – GA4 filters bot traffic. Application Insights captures all pageviews unless you have WAF-level bot blocking configured.
- Ad blockers and privacy tools – These commonly block GA4 but may not block Application Insights.
- iFramed elements – Application Insights captures the full page render, including third-party iFrames. GA4 typically does not.
Why is my pageview data low or zero for a specific period?
A missing or broken tracking snippet is the most common cause of a sudden, large drop. Pageview data can also take up to 7 days to fully settle, so a query for the same date can return different results on different days. If data is missing for longer than 7 days, submit a support ticket.
CMS (SaaS)
Why does my content item count differ when I run a query in CMS?
When you run a query in the CMS or GraphiQL interface, the system uses single-key authentication by default. This returns only public and published content. To get a complete count, use HMAC or Basic authentication. These methods return all content items, including unpublished content and content with access restrictions.
How are named users counted?
Named users are people you authorize to use CMS (SaaS). The count is a limit that you cannot exceed at any point, not a total over the contract term. Users are counted across your organization, so the same user is counted once even if they have access to multiple CMS instances. Any user with at least one CMS role is counted, regardless of which roles they have.
Mark
Are credits allocated to a specific instance?
No. Credits are purchased for your organization. You cannot limit credits per instance.
Can I see credits broken down in different ways?
Yes. In addition to organization-level totals, you can view credits by user and by agent in Usage & Billing.
How are credits calculated?
Credit calculation takes into account the input tokens, output tokens, number of tools called, and the model used.
Configured Commerce
How are transactions calculated?
A transaction is any order, quote, or requisition that is submitted through your e-commerce site or API and moves to Submitted status.
Commerce Connect
Why does my transaction volume not display in the Admin Center?
Commerce Connect is a PaaS solution, so transaction volume does not display in the Admin Center. Report your transaction volume to your Optimizely account team as required by your contract.