Dashboard overview
3 min
Optimizely Commerce Connect provides a dashboard that displays metrics when you log in.
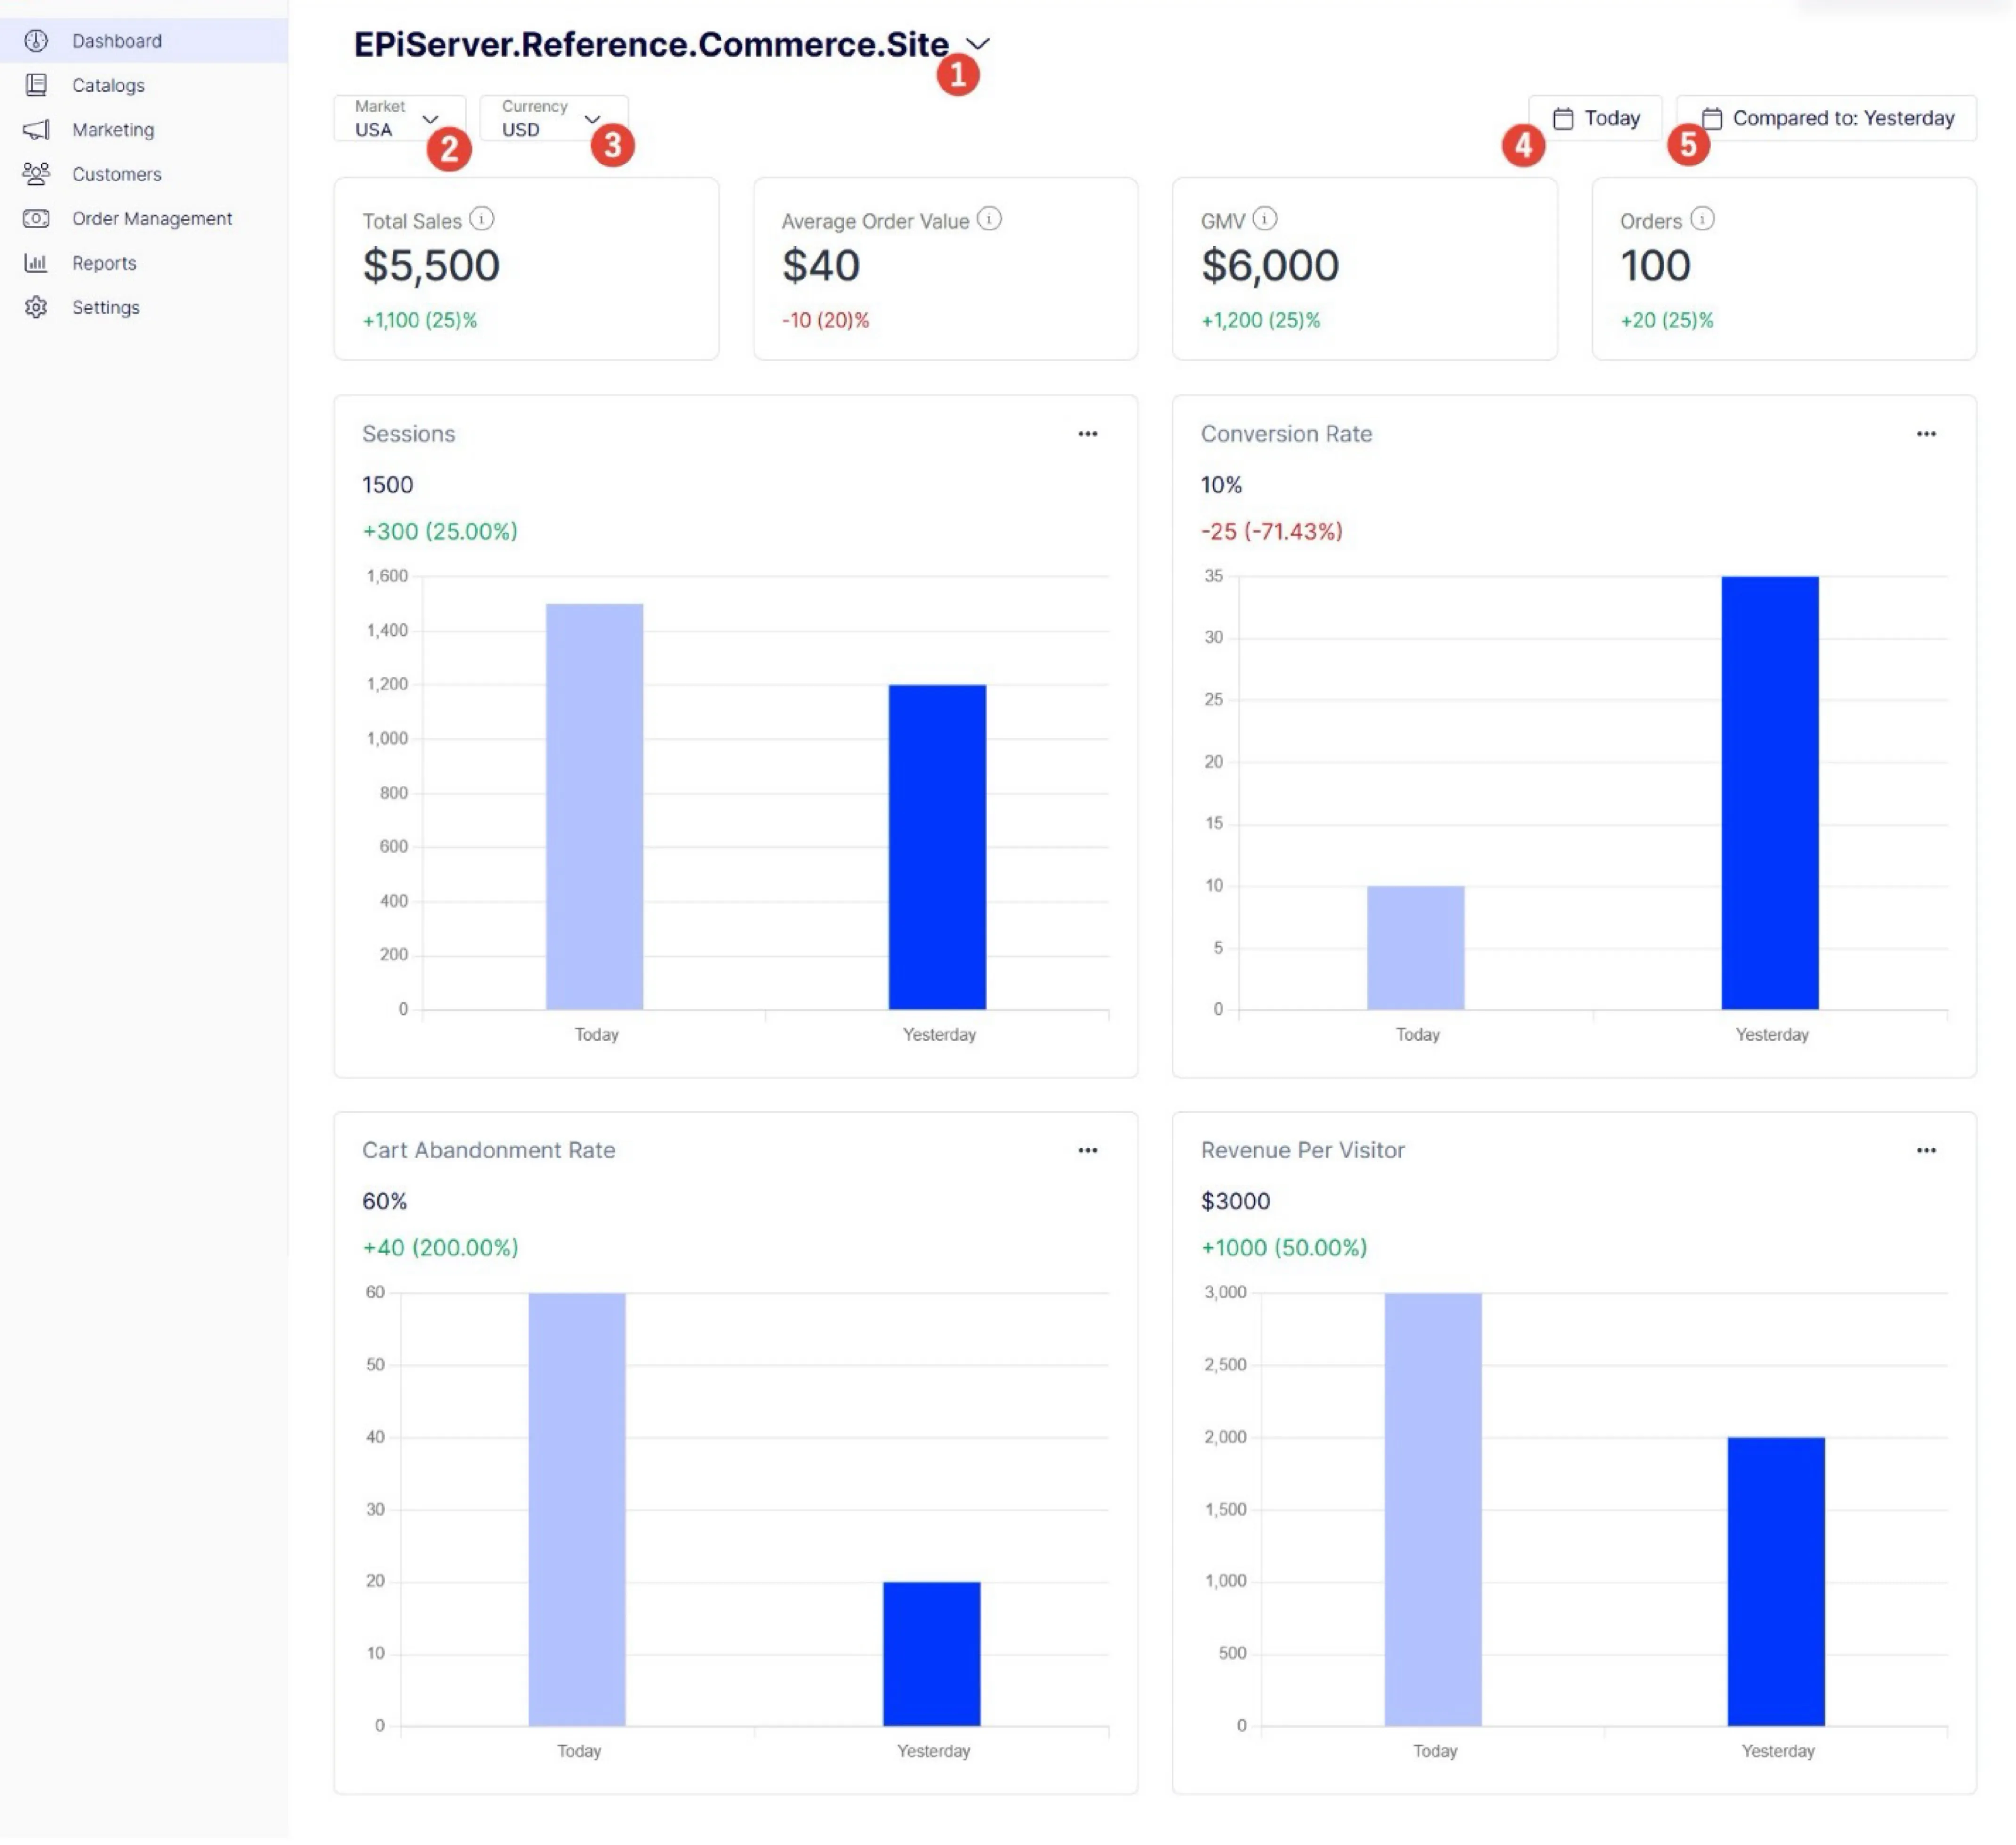
The page contains options to edit what data displays for each metric and chart.
- Change Website – Click the dashboard's title to select a different website.
- Market – Choose a market, such as USA.
- Currency – Choose what currency to use, such as USD.
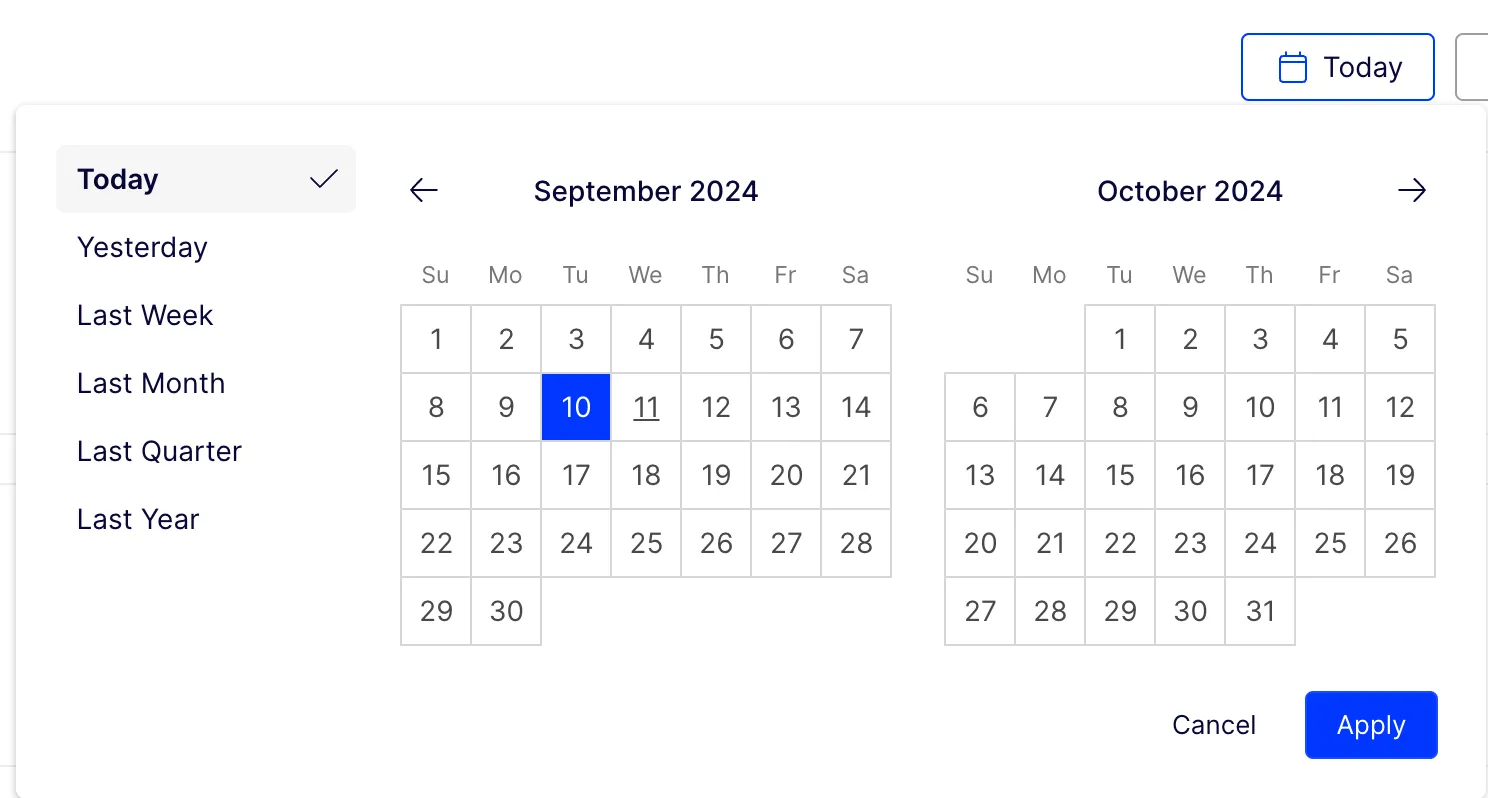
- Date Picker – Select the time period for the data. Premade options include Today, Yesterday, Last week, Last month, Last quarter, and Last year. Click Apply.
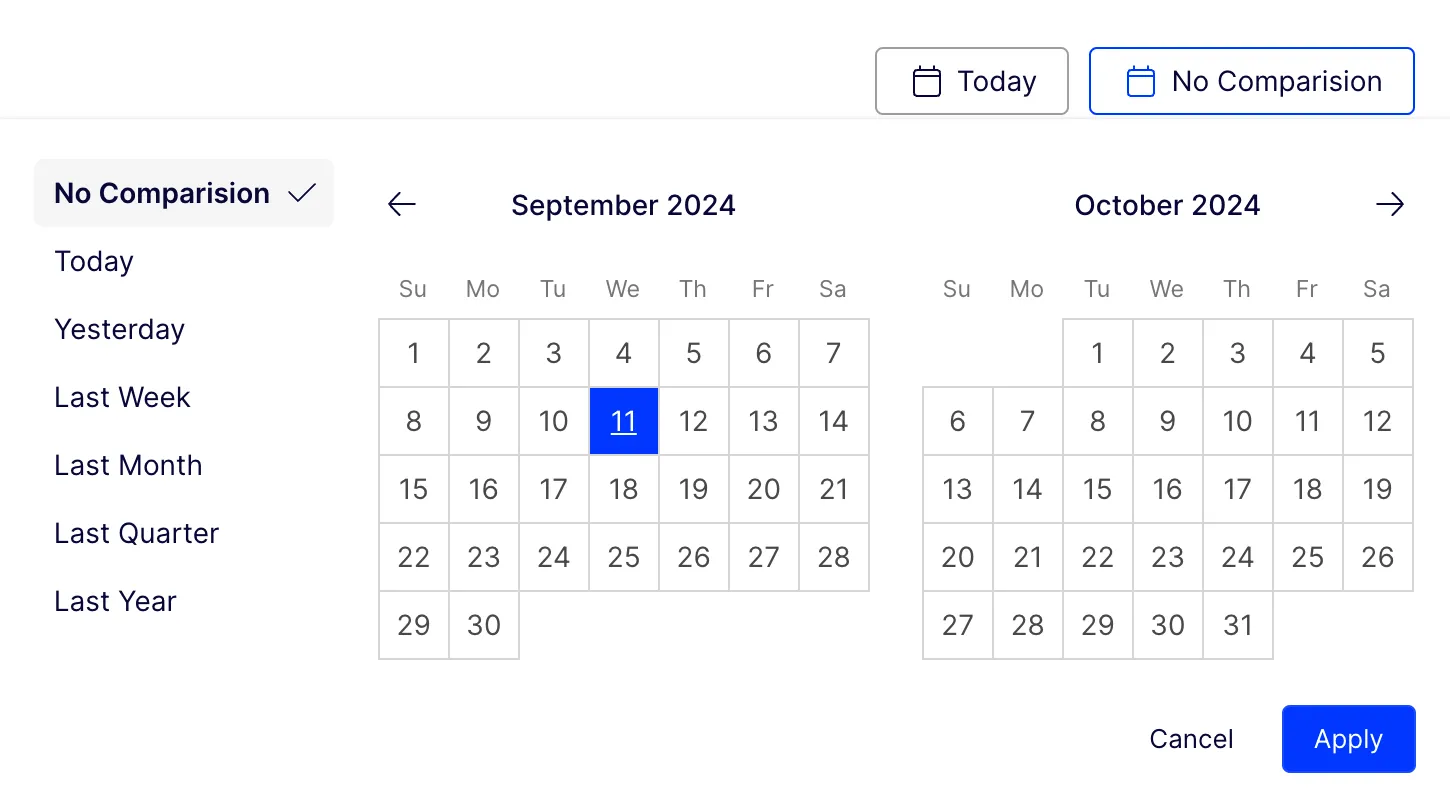
- Compare to – Select a time period for comparing the data. Premade options include Today, Yesterday, Last week, Last month, Last quarter, and Last year. Click Apply.
The dashboard tracks the following metrics:
- Total Sales – Gross sales including shipping, taxes, duties, and fees, minus any discounts and returns. This includes all sales channels.
- Average Order Value – Gross sales (minus discounts) divided by the total number of orders. This excludes edits, exchanges, or returns made to an order after initial placement.
- GMV – Sales price of products multiplied by the number of products sold.
- Orders – Total number of orders made across all sales channels.
- Sessions chart – Number of user sessions over time. A session represents a period of user activity on your site. This chart helps monitor overall site traffic trends or identify peak activity periods. To enable tracking the session, a developer must add the following configuration in appsettings.json:
{
  "Commerce": {
    "DashboardOptions": {
      "EnableTrackingSession": true
    }
  }
}
If you do not have this setting, the default value of EnableTrackingSession is false, and the chart is blank.
- Conversion Rate – Percentage of the number of conversions (customers who already purchased) for total number of visitors (unique website visitors) in a period.

- Cart Abandonment Rate – Percentage of shopping carts that were abandoned. This chart compares abandonment rates over time and helps monitor the effectiveness of cart recovery strategies.

- Revenue Per Visitor – The average revenue generated from each site visitor. This chart measures the value each visitor brings to your business and tracks changes in visitor quality or spending habits.

📘 Note Use the Order per hour schedule job to collect and save order data by hour. See Scheduled jobsScheduled jobs for information.